Table 9.2 Average Returns for Bonds Low-risk bonds 1950 to 1959 Average 2.3 % 1960...
| Table 9.2 Average Returns for Bonds |
| Low-risk bonds | ||||
| 1950 to 1959 | Average | 2.3 | % | |
| 1960 to 1969 | Average | 4.1 | ||
| 1970 to 1979 | Average | 6.0 | ||
| 1980 to 1989 | Average | 8.4 | ||
| 1990 to 1999 | Average | 4.8 | ||
| 2000 to 2009 | Average | 2.6 | ||
| Table 9.4 Annual Standard Deviation for T-Bills |
| Low-risk bonds | |||
| 1950 to 1959 | 1.2 | % | |
| 1960 to 1969 | 1.9 | ||
| 1970 to 1979 | 2.1 | ||
| 1980 to 1989 | 2.5 | ||
| 1990 to 1999 | 1.4 | ||
| 2000 to 2009 | 2.2 | ||
|
Use the tables above to calculate the coefficient of variation of the risk-return relationship in T-bills during each decade since 1950. (Round your answers to 2 decimal places.) |
| Decade | CoV |
| 1950s | |
| 1960s | |
| 1970s | |
| 1980s | |
| 1990s | |
| 2000s | |
Homework Answers
SEE THE IMAGE. ANY DOUBTS, FEEL FREE TO ASK. THUMBS UP
PLEASE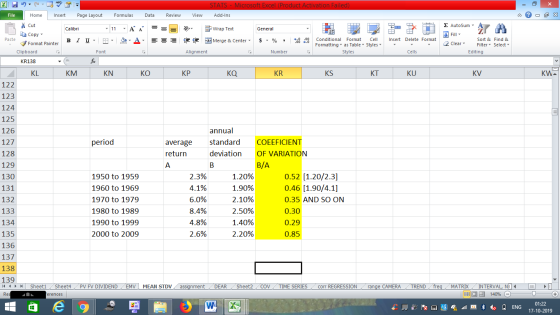
Add Answer to:
Table 9.2 Average Returns for Bonds
Low-risk bonds
1950 to 1959
Average
2.3
%
1960...
thats all the information present. 10. Calculate the CoV of the risk-return relationship of the bond...
 thats all the information present.
10. Calculate the CoV of the risk-return relationship of the bond market (Use the Tables below) during each decade since 1950. (Round your answers to 2 decimal places.) Table 10.1 AVG Returns for Bonds LT Treasury Bonds 0.0% 1.6 Table 10.2 Annual STDEV for Bonds LT Treasury Bonds 4.9% Decade 1950 to 1959 1960 to 1969 1970 to 1979 Decade 1950 to 1959 1960 to 1969 1970 to 1979 1980 to 1989 6.2 5.7 6.8...
thats all the information present.
10. Calculate the CoV of the risk-return relationship of the bond market (Use the Tables below) during each decade since 1950. (Round your answers to 2 decimal places.) Table 10.1 AVG Returns for Bonds LT Treasury Bonds 0.0% 1.6 Table 10.2 Annual STDEV for Bonds LT Treasury Bonds 4.9% Decade 1950 to 1959 1960 to 1969 1970 to 1979 Decade 1950 to 1959 1960 to 1969 1970 to 1979 1980 to 1989 6.2 5.7 6.8...
use the tables to calculate the coefficient to variation of the risk-return relationship of the bond...
 use the tables to calculate the coefficient to
variation of the risk-return relationship of the bond market during
each decade since 1950. (round your answer to 2 decimals).
Table 9.2 Average Retuns for Bonds 0.0% 1950 to 1959 Average 1960 to 1969 Average 1970 to 1979 Average54 1980 to 1989 Average1 1990 to 1999 Average9.5 2000 to 2009 Average 1.8 13.5 8.7 Table 9.4 Annual Standard Deviation for Bonds Bonds 1950 to 1959: 4.6% 1960 to 1969 6.5 1970 to...
use the tables to calculate the coefficient to
variation of the risk-return relationship of the bond market during
each decade since 1950. (round your answer to 2 decimals).
Table 9.2 Average Retuns for Bonds 0.0% 1950 to 1959 Average 1960 to 1969 Average 1970 to 1979 Average54 1980 to 1989 Average1 1990 to 1999 Average9.5 2000 to 2009 Average 1.8 13.5 8.7 Table 9.4 Annual Standard Deviation for Bonds Bonds 1950 to 1959: 4.6% 1960 to 1969 6.5 1970 to...
Rank the following three stocks by their risk-return relationship, best to worst. Rail Haul has an...
 Rank the following three stocks by their risk-return relationship, best to worst. Rail Haul has an average return of 14 percent and standard deviation of 36 percent. The average return and standard deviation of Idol Staff are 17 percent and 32 percent; and of Poker R-Us are 11 percent and 30 percent. Rank Stock Table 9.2 Average Returns for Bonds T-Billa 2.66 1950 to 1959 Average 1960 to 1969 Average 1970 to 1979 Average 1980 to 1989 Average 1990 to...
Annual and Average Returns for Stocks, Bonds, and T-Bills, 1950 to 2015 Stoeks Longter Treasury Bonds...
 Annual and Average Returns for Stocks, Bonds, and T-Bills, 1950 to 2015 Stoeks Longter Treasury Bonds 1-bills Average 12.60 4.400 2.00 th 1950 to 2015 1950 ta 1959 1960 to 1969 1970 to 1979 1980 to 1989 1990 to wa 1999 0.01 0.02 16.0 0.02 2000 to 2009 Annual 2010 Return Annual 2011 Return Annual Return Annual Return Annual 2014 Return annual 2015 Return 2010 to Average 2015 0.07 0.05 0.0€ You have a portfolio with an asset allocation of...
Annual and Average Returns for Stocks, Bonds, and T-Bills, 1950 to 2017 Long-Term Treasury Bonds 6.6%...
 Annual and Average Returns for Stocks, Bonds, and T-Bills, 1950 to 2017 Long-Term Treasury Bonds 6.6% 0.0 1.6 1950 to 2017 Average 1950 to 1959 Average 1960 to 1969 Average 1970 to 1979 Average 1980 to 1989 Average 1990 to 1999 Average 2000 to 2009 Average Annual Return 2011 Annual Return 2012 Annual Return 2013 Annual Return 2014 Annual Return 2015 Annual Return 2016 Annual Return 2017 Annual Return 2010 to 2017 Average Stocks 12.7% 20.9 8.7 7.5 18.2 19.0...
Annual and Average Returns for Stocks, Bonds, and T-Bills, 1950 to 2015 Long-Term Treasury B onds...
 Annual and Average Returns for Stocks, Bonds, and T-Bills, 1950 to 2015 Long-Term Treasury B onds 6.6% .0 1.6 5.7 13.5 Stocks 12.6% 9 28. 8.7 7.5 18.2 19.0 0.9 15.1 2.1 16. 32.4 13.7 1.4 1950 to 2015 Average 1950 to 1959 Average 1960 to 1969 Average 1970 to 1979 Average 1980 to 1989 Average 1990 to 1999 Average 2009 to 2009 Average 2010 Annual Return 2011 Annual Return 2012 Annual Return al Return 2013 Annual Return 2014 Annual...
value: 10.00 points Average Daily TV Viewing Time Per U.S. Household Year 1950 1955 1960 1965...
 value: 10.00 points Average Daily TV Viewing Time Per U.S. Household Year 1950 1955 1960 1965 1970 1975 1980 1985 1990 1995 2000 2005 2010 Hours 4 Min 34 Total Min 274 309 330 367 390 418 431 453 441 468 492 506 534 30 30 58 21 48 12 26 54 8 E& Click here for the Excel Data File (a) Fit a linear trend to the Total Min data. (Round your answers to 2 decimal places.) (b) Make...
CHAPTER COMMON STOCKS TABLE 6.1 HISTORICAL RETURNS ON THE STANDARD AND POOR S 500, 1950-2010 Rate...
 CHAPTER COMMON STOCKS TABLE 6.1 HISTORICAL RETURNS ON THE STANDARD AND POOR S 500, 1950-2010 Rate of Return from Dividends 1%) Rate of Return from Capital Gain Total Remas 1980s 1970s 1980s 1900 2000s 1950-2010 Note: The total return is gher than the sum of the dividend ande assume dividends are invested when received Source: www.simplestockveting.com/ hi m ala r e volatility (even in good markets, but that's the price you pay for all the upside pe tial. For example,...
Oil prices have increased a great deal in the last decade. The following table shows the...
 Oil prices have increased a great deal in the last decade. The following table shows the average oil price for each year since 1949. Many companies use oil products as a resource in their own business operations (like airline firms and manufacturers of plastic products). Managers of these firms will keep a close watch on how rising oil prices will impact their costs. The interest rate in the PV/FV equations can also be interpreted as a growth rate in sales,...
1) the distribution and histogram of individual penny dates for the entire class (this will be our population), Math/BSAD 2170 Sampling Distributions and Central Limit Theorem 2) the dis...
 1) the distribution and histogram of individual penny dates for the entire class (this will be our population), Math/BSAD 2170 Sampling Distributions and Central Limit Theorem 2) the distribution and histogram of the means from samples of 5 pennies (this is called a sampling distribution with n 5), 3) the distribution and histogram of the means from samples of 10 pennies (a sampling distribution with n 10), and 4) the distribution and histogram of the means of each sample of...
 thats all the information present.
10. Calculate the CoV of the risk-return relationship of the bond market (Use the Tables below) during each decade since 1950. (Round your answers to 2 decimal places.) Table 10.1 AVG Returns for Bonds LT Treasury Bonds 0.0% 1.6 Table 10.2 Annual STDEV for Bonds LT Treasury Bonds 4.9% Decade 1950 to 1959 1960 to 1969 1970 to 1979 Decade 1950 to 1959 1960 to 1969 1970 to 1979 1980 to 1989 6.2 5.7 6.8...
thats all the information present.
10. Calculate the CoV of the risk-return relationship of the bond market (Use the Tables below) during each decade since 1950. (Round your answers to 2 decimal places.) Table 10.1 AVG Returns for Bonds LT Treasury Bonds 0.0% 1.6 Table 10.2 Annual STDEV for Bonds LT Treasury Bonds 4.9% Decade 1950 to 1959 1960 to 1969 1970 to 1979 Decade 1950 to 1959 1960 to 1969 1970 to 1979 1980 to 1989 6.2 5.7 6.8...
 use the tables to calculate the coefficient to
variation of the risk-return relationship of the bond market during
each decade since 1950. (round your answer to 2 decimals).
Table 9.2 Average Retuns for Bonds 0.0% 1950 to 1959 Average 1960 to 1969 Average 1970 to 1979 Average54 1980 to 1989 Average1 1990 to 1999 Average9.5 2000 to 2009 Average 1.8 13.5 8.7 Table 9.4 Annual Standard Deviation for Bonds Bonds 1950 to 1959: 4.6% 1960 to 1969 6.5 1970 to...
use the tables to calculate the coefficient to
variation of the risk-return relationship of the bond market during
each decade since 1950. (round your answer to 2 decimals).
Table 9.2 Average Retuns for Bonds 0.0% 1950 to 1959 Average 1960 to 1969 Average 1970 to 1979 Average54 1980 to 1989 Average1 1990 to 1999 Average9.5 2000 to 2009 Average 1.8 13.5 8.7 Table 9.4 Annual Standard Deviation for Bonds Bonds 1950 to 1959: 4.6% 1960 to 1969 6.5 1970 to...
 Rank the following three stocks by their risk-return relationship, best to worst. Rail Haul has an average return of 14 percent and standard deviation of 36 percent. The average return and standard deviation of Idol Staff are 17 percent and 32 percent; and of Poker R-Us are 11 percent and 30 percent. Rank Stock Table 9.2 Average Returns for Bonds T-Billa 2.66 1950 to 1959 Average 1960 to 1969 Average 1970 to 1979 Average 1980 to 1989 Average 1990 to...
 Annual and Average Returns for Stocks, Bonds, and T-Bills, 1950 to 2015 Stoeks Longter Treasury Bonds 1-bills Average 12.60 4.400 2.00 th 1950 to 2015 1950 ta 1959 1960 to 1969 1970 to 1979 1980 to 1989 1990 to wa 1999 0.01 0.02 16.0 0.02 2000 to 2009 Annual 2010 Return Annual 2011 Return Annual Return Annual Return Annual 2014 Return annual 2015 Return 2010 to Average 2015 0.07 0.05 0.0€ You have a portfolio with an asset allocation of...
 Annual and Average Returns for Stocks, Bonds, and T-Bills, 1950 to 2017 Long-Term Treasury Bonds 6.6% 0.0 1.6 1950 to 2017 Average 1950 to 1959 Average 1960 to 1969 Average 1970 to 1979 Average 1980 to 1989 Average 1990 to 1999 Average 2000 to 2009 Average Annual Return 2011 Annual Return 2012 Annual Return 2013 Annual Return 2014 Annual Return 2015 Annual Return 2016 Annual Return 2017 Annual Return 2010 to 2017 Average Stocks 12.7% 20.9 8.7 7.5 18.2 19.0...
 Annual and Average Returns for Stocks, Bonds, and T-Bills, 1950 to 2015 Long-Term Treasury B onds 6.6% .0 1.6 5.7 13.5 Stocks 12.6% 9 28. 8.7 7.5 18.2 19.0 0.9 15.1 2.1 16. 32.4 13.7 1.4 1950 to 2015 Average 1950 to 1959 Average 1960 to 1969 Average 1970 to 1979 Average 1980 to 1989 Average 1990 to 1999 Average 2009 to 2009 Average 2010 Annual Return 2011 Annual Return 2012 Annual Return al Return 2013 Annual Return 2014 Annual...
 value: 10.00 points Average Daily TV Viewing Time Per U.S. Household Year 1950 1955 1960 1965 1970 1975 1980 1985 1990 1995 2000 2005 2010 Hours 4 Min 34 Total Min 274 309 330 367 390 418 431 453 441 468 492 506 534 30 30 58 21 48 12 26 54 8 E& Click here for the Excel Data File (a) Fit a linear trend to the Total Min data. (Round your answers to 2 decimal places.) (b) Make...
 CHAPTER COMMON STOCKS TABLE 6.1 HISTORICAL RETURNS ON THE STANDARD AND POOR S 500, 1950-2010 Rate of Return from Dividends 1%) Rate of Return from Capital Gain Total Remas 1980s 1970s 1980s 1900 2000s 1950-2010 Note: The total return is gher than the sum of the dividend ande assume dividends are invested when received Source: www.simplestockveting.com/ hi m ala r e volatility (even in good markets, but that's the price you pay for all the upside pe tial. For example,...
 Oil prices have increased a great deal in the last decade. The following table shows the average oil price for each year since 1949. Many companies use oil products as a resource in their own business operations (like airline firms and manufacturers of plastic products). Managers of these firms will keep a close watch on how rising oil prices will impact their costs. The interest rate in the PV/FV equations can also be interpreted as a growth rate in sales,...
 1) the distribution and histogram of individual penny dates for the entire class (this will be our population), Math/BSAD 2170 Sampling Distributions and Central Limit Theorem 2) the distribution and histogram of the means from samples of 5 pennies (this is called a sampling distribution with n 5), 3) the distribution and histogram of the means from samples of 10 pennies (a sampling distribution with n 10), and 4) the distribution and histogram of the means of each sample of...
Most questions answered within 3 hours.
-
For the following reaction, 0.128 moles of
potassium hydrogen sulfateare mixed with
0.504 moles of potassium...
asked 2 hours ago -
1. What is the present value of $400, three years in the future
if the interest...
asked 3 hours ago -
The labor force minus the number of employed equals the number
of unemployed.
a. True
b....
asked 5 hours ago -
Determine the mass in units of grams [g] of 0.49 moles [mol]
of a new fictitious...
asked 5 hours ago -
A horizontal mass of M=5kg is on a spring and stretched to
x=0.5m when released from...
asked 7 hours ago -
26 of 50
"I have worked at the Arizona Humane Society for ten years, and
have...
asked 7 hours ago -
Compare and contrast zero based budgeting and incremental (or
base year) budgeting.
asked 7 hours ago -
4 pts 10. Which of the following hypothesis would be MOST
difficult to test experimentally? Group...
asked 7 hours ago -
A business owner makes 1,000 items a day. Each day he or she
contributes eight hours...
asked 7 hours ago -
A
circular loop in the plane of a paper lies inca0.65 T magnetic
field pointing into...
asked 7 hours ago -
A business owner is trying to decide whether to buy, rent, or
lease office space and...
asked 7 hours ago -
Thermal Storage Solar heating of a house is much more efficient
if there is a way...
asked 8 hours ago