
Note : the answer should be computerized please
Homework Answers
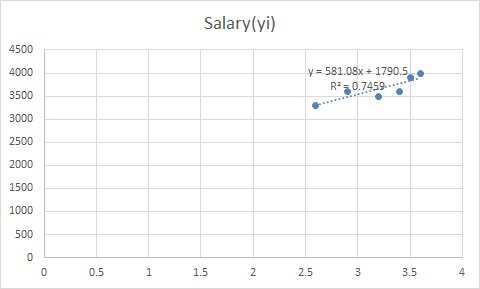
Ans:
| GPA(x) | Salary(y) | xy | x^2 | y^2 | |
| 1 | 2.6 | 3300 | 8580 | 6.76 | 10890000 |
| 2 | 3.4 | 3600 | 12240 | 11.56 | 12960000 |
| 3 | 3.6 | 4000 | 14400 | 12.96 | 16000000 |
| 4 | 3.2 | 3500 | 11200 | 10.24 | 12250000 |
| 5 | 3.5 | 3900 | 13650 | 12.25 | 15210000 |
| 6 | 2.9 | 3600 | 10440 | 8.41 | 12960000 |
| Sum= | 19.2 | 21900 | 70510 | 62.18 | 80270000 |
Slope,b=(6*70510-19.2*21900)/(6*62.18-19.2^2)=581.08
y-intercept,a=(21900-581.0811*19.2)/6=1790.54
Regression eqn:
y'=581.08x+1790.54
when x=3.85
y'=581.08*3.85+1790.54=4027.70
Cofficient of correlation,r=(6*70510-19.2*21900)/SQRT((6*62.18-19.2^2)*(6*80270000-21900^2))=0.864
There is strong positive correlation between GPA and salary,higher the GPA and higher the salary.
Add Answer to:
Note : the answer should be computerized
please
Question 2. linear Regr ession (5Marks) The following...
Name Economics 5 Ch 13 Practice The follo wing data are the monthly salaries y and the grade point averages x for students who obtained a bachelor's degree in business administ ration Obser vatio...
 Name Economics 5 Ch 13 Practice The follo wing data are the monthly salaries y and the grade point averages x for students who obtained a bachelor's degree in business administ ration Obser vation index xi 2.6 3300 3.4 3600 3.6 4000 3.2 3500 3.5 3900 2.9 3600 TSS Totals SSR SSE 1. Calculate and y 2. Use the least squares method to develop the estimated regression equation. Use two decimal points in your answers for bo and bi. 3....
stats
 The following data are the monthly salaries y and the grade point averages x for students who obtained a bachelor's degree in business administration.GPAMonthly Salary ($)2.63,5003.43,9003.64,3003.23,7003.54,2002.92,300The estimated regression equation for these data is = -544.6 + 1,310.8x and MSE =340,878. Use Table 1 of Appendix B.a. Develop a point estimate of the starting salary for a student with a GPA of 3.0 (to 1 decimal).$b. Develop a 95% confidence interval for the mean starting salary for all students with a 3.0 GPA (to 2 decimals).$ ( , )c. Develop a...
The following data are the monthly salaries y and the grade point averages x for students...
 The following data are the monthly salaries y and the grade point averages x for students who obtained a bachelor's degree in business administration. GPA 2.6 3.4 3.6 3.1 3.4 3.1 Monthly Salary ($) 3,500 3,800 4,200 3,800 4,100 2,500 The estimated regression equation for these data is y 914.5 854.8x and MSE 360,484. a. Develop a point estimate of the starting salary for a student with a GPA of 3.0 (to 1 decimal). b. Develop a 95% confidence interval...
A university would like to describe the relationship between the GPA and the starting monthly salary...
 A university would like to describe the relationship between the GPA and the starting monthly salary of a graduate who earned a business degree from the university. The accompanying table shows the monthly starting salaries for eight graduates of the business school along with their corresponding GPAs. Determine the sample correlation coefficient between the starting salary and the GPA of a business graduate of the university Click the icon to view the salary and GPA data. (Round to three decimal...
The following data are the monthly salaries y and the grade point averages x for students...
 The following data are the monthly salaries y and the grade point averages x for students who obtained a bachelor's degree in business administration. GPA 2.6 3.4 3.7 3.1 3.5 2.9 Monthly Salary (S) 3,600 3,800 4,200 3,700 4,100 2,500 The estimated regression equation for these data is y- 564.3 +964.3x and MSE-268,482. a. Develop a point estimate of the starting salary for a student with a GPA of 3.0 (to 1 decimal). b. Develop a 95% confidence interval for...
please show answers clearly You may need to use the appropriate technology to answer this question....
 please show answers clearly
You may need to use the appropriate technology to answer this question. Do students with higher college grade point averages (GPA) earn more than those graduates with lower GPAS?? Consider the following hypothetical college GPA and salary data (10 years after graduation). GPA Salary (8) 2.22 72,000 2.27 48.000 2.57 72,000 2.59 62,000 2.77 86,000 2.85 96,000 3.12 133,000 3.35 130,000 3.66 157,000 3.68 162,000 (a) Develop a scatter diagram for these data with college GPA...
please show answers clearly
You may need to use the appropriate technology to answer this question. Do students with higher college grade point averages (GPA) earn more than those graduates with lower GPAS?? Consider the following hypothetical college GPA and salary data (10 years after graduation). GPA Salary (8) 2.22 72,000 2.27 48.000 2.57 72,000 2.59 62,000 2.77 86,000 2.85 96,000 3.12 133,000 3.35 130,000 3.66 157,000 3.68 162,000 (a) Develop a scatter diagram for these data with college GPA...
The following data are the monthly salaries y and the grade point averages x for students...
 The following data are the monthly salaries y and the grade point averages x for students who obtained a bachelor's degree in business administration GPA 2.7 3.4 3.7 3.1 3.4 2.9 Monthly Salary ($) 3,500 3,800 4,300 3,800 4,200 2,300 The estimated regression equation for these data is y- -726.5 1,367.6x and MSE 335,772 a. Develop a point estimate of the starting salary for a student with a GPA of 3.0 (to 1 decimal) b. Develop a 95% confidence interval...
The following data are the monthly salaries y and the grade point averages x for students...
 The following data are the monthly salaries y and the grade point averages x for students who obtained a bachelor's degree in business administration. GPA 2.7 3.5 3.7 3.2 3.4 2.7 Monthly Salary () 3,500 3,900 4,200 3,700 4,100 2,500 The estimated regression equation for these data is y-313.6+1,238.6x and MSE-141,222 a. Developa point estimate of the starting salary for a student with a GPA of 3.0 (to 1 decimal) b. Develop a 95% confidence interval for the mean sta...
the following data are the monthly salaries y and the grade point averages x for students who obtained a bachelor's degree in business administration. GPA Monthly Salary ($) 2.7 3,500 3.4 3...
the following data are the monthly salaries y and the grade point averages x for students who obtained a bachelor's degree in business administration. GPA Monthly Salary ($) 2.7 3,500 3.4 3,800 3.7 4,200 3.2 3,700 3.5 4,200 2.7 2,500 The estimated regression equation for these data is = -422.7 + 1,272.7x and MSE =137,386. a. Develop a point estimate of the starting salary for a student with a GPA of 3.0 (to 1 decimal). $ b. Develop a 95%...
The following data are the monthly salaries y and the grade point averages x for students...
The following data are the monthly salaries y and the grade point averages x for students who obtained a bachelor's degree in business administration. GPA Monthly Salary ($) 2.7 3,500 3.4 3,900 3.7 4,300 3.2 3,800 3.5 4,100 2.7 2,300 The estimated regression equation for these data is ŷ = -931.8 + 1,431.8x and MSE =187,727. a. Develop a point estimate of the starting salary for a student with a GPA of 3.0 (to 1 decimal). $ b. Develop a...
 Name Economics 5 Ch 13 Practice The follo wing data are the monthly salaries y and the grade point averages x for students who obtained a bachelor's degree in business administ ration Obser vation index xi 2.6 3300 3.4 3600 3.6 4000 3.2 3500 3.5 3900 2.9 3600 TSS Totals SSR SSE 1. Calculate and y 2. Use the least squares method to develop the estimated regression equation. Use two decimal points in your answers for bo and bi. 3....
 The following data are the monthly salaries y and the grade point averages x for students who obtained a bachelor's degree in business administration. GPA 2.6 3.4 3.6 3.1 3.4 3.1 Monthly Salary ($) 3,500 3,800 4,200 3,800 4,100 2,500 The estimated regression equation for these data is y 914.5 854.8x and MSE 360,484. a. Develop a point estimate of the starting salary for a student with a GPA of 3.0 (to 1 decimal). b. Develop a 95% confidence interval...
 A university would like to describe the relationship between the GPA and the starting monthly salary of a graduate who earned a business degree from the university. The accompanying table shows the monthly starting salaries for eight graduates of the business school along with their corresponding GPAs. Determine the sample correlation coefficient between the starting salary and the GPA of a business graduate of the university Click the icon to view the salary and GPA data. (Round to three decimal...
 The following data are the monthly salaries y and the grade point averages x for students who obtained a bachelor's degree in business administration. GPA 2.6 3.4 3.7 3.1 3.5 2.9 Monthly Salary (S) 3,600 3,800 4,200 3,700 4,100 2,500 The estimated regression equation for these data is y- 564.3 +964.3x and MSE-268,482. a. Develop a point estimate of the starting salary for a student with a GPA of 3.0 (to 1 decimal). b. Develop a 95% confidence interval for...
 please show answers clearly
You may need to use the appropriate technology to answer this question. Do students with higher college grade point averages (GPA) earn more than those graduates with lower GPAS?? Consider the following hypothetical college GPA and salary data (10 years after graduation). GPA Salary (8) 2.22 72,000 2.27 48.000 2.57 72,000 2.59 62,000 2.77 86,000 2.85 96,000 3.12 133,000 3.35 130,000 3.66 157,000 3.68 162,000 (a) Develop a scatter diagram for these data with college GPA...
please show answers clearly
You may need to use the appropriate technology to answer this question. Do students with higher college grade point averages (GPA) earn more than those graduates with lower GPAS?? Consider the following hypothetical college GPA and salary data (10 years after graduation). GPA Salary (8) 2.22 72,000 2.27 48.000 2.57 72,000 2.59 62,000 2.77 86,000 2.85 96,000 3.12 133,000 3.35 130,000 3.66 157,000 3.68 162,000 (a) Develop a scatter diagram for these data with college GPA...
 The following data are the monthly salaries y and the grade point averages x for students who obtained a bachelor's degree in business administration GPA 2.7 3.4 3.7 3.1 3.4 2.9 Monthly Salary ($) 3,500 3,800 4,300 3,800 4,200 2,300 The estimated regression equation for these data is y- -726.5 1,367.6x and MSE 335,772 a. Develop a point estimate of the starting salary for a student with a GPA of 3.0 (to 1 decimal) b. Develop a 95% confidence interval...
 The following data are the monthly salaries y and the grade point averages x for students who obtained a bachelor's degree in business administration. GPA 2.7 3.5 3.7 3.2 3.4 2.7 Monthly Salary () 3,500 3,900 4,200 3,700 4,100 2,500 The estimated regression equation for these data is y-313.6+1,238.6x and MSE-141,222 a. Developa point estimate of the starting salary for a student with a GPA of 3.0 (to 1 decimal) b. Develop a 95% confidence interval for the mean sta...
Most questions answered within 3 hours.
-
Discuss the pros and cons of collaborative software such
as SameTime. Does it increase productivity? What...
asked 1 minute ago -
A large cable company reports the following.
80% of its customers subscribe to its cable TV...
asked 3 minutes ago -
Buying your in-laws a gift because it’s expected is
due to the ____________ motive of gift-giving....
asked 4 minutes ago -
Calculate the expected value, the variance, and the standard
deviation of the given random variable X....
asked 47 minutes ago -
A hospital performs 100 surgeries per week. The probability that
complications after surgery occur is 10%....
asked 1 hour ago -
1 point) Given the significance level α=0.01 find the following:
(a) left-tailed z value z= (b)...
asked 45 minutes ago -
Assuming you are the head of the software development unit at
Cyber.Soft, explain and justify why...
asked 11 minutes ago -
Magnesium and nitrogen react in a combination reaction to
produce magnesium nitride. 3 Mg + N2...
asked 19 minutes ago -
Two electrons are initially at rest separated by a distance of
2nm. At time t=0, they...
asked 17 minutes ago -
A martial artist is practicing breaking 5 boards. He is able to
break aboard with probability...
asked 25 minutes ago -
The rate constant of a first-order reaction is 2.95 × 10⁻⁴ s−1
at 350.° C. If...
asked 28 minutes ago -
implement a class called PiggyBank that will be used to
represent a collection of coins. Functionality...
asked 19 minutes ago