
Homework Answers
Apology for the mistakes.
Add Answer to:
Chapter 12, Problem 12.16 Describe the sketch of the magnitude characteristic of the Bode plot for...
Chapter 12, Problem 12.21 (Multistep) Part 1 Correct. Sketch the magnitude characteristic of the Bode plot...
 Chapter 12, Problem 12.21 (Multistep) Part 1 Correct. Sketch the magnitude characteristic of the Bode plot for the transfer function 30(0.060 * jo + 1) jojo + 1)(0.0024 * ja + 1) H0) = Shown here is the radian frequency axis for w > 0. The labeled frequencies represent the break frequencies in the transfer function H(o) (not necessarily drawn to scale). -+ W + w W3 W (rad/sec) What are the numerical values of the break frequencies w1, wz,...
Chapter 12, Problem 12.13 Your answer is partially correct. Try again. Choose the correct drawing of...
 Chapter 12, Problem 12.13 Your answer is partially correct. Try again. Choose the correct drawing of the Bode plot for the network function 16ίώ + 1 The magnitude plot has a slope of I-20 dB/decade from us 0 to ω.10:06 rad/s, a slope of dB/decade from ool to ω2-1120.05 rad/s, and a slope of 2 20 dB/decade 70 from ω2 to co. The value of the magnitude asymptotes between ω1 and ω2 is dB. Click if you would like to...
4. Draw the magnitude characteristic of the Bode plot of the following transfer function: 10s H...
 4. Draw the magnitude characteristic of the Bode plot of the following transfer function: 10s H (s) =-= (s+1)(s+102 L7n Identify the poles and zeros Sketch the magnitude plot. The y-axis should be in dB. The x-axis should logarithmic, but labeled in rad/sec Use MATLAB to draw the complete Bode plot and check your answer. If the input current is un(t) = 2 cos(20t + 5°), what is the output voltage. Use your MATLAB Bode plot to answer this a)...
Hw 10 Problem 2 2. Draw the magnitude characteristic of the Bode plot of the following...
 Hw 10 Problem 2 2. Draw the magnitude characteristic of the Bode plot of the following transfer function: HG) = (s +5)(s +10) 5 + 5 + 10) a) Identify the poles and zeros. Enter values beginning with the poles and zeros whose real parts are closest to the origin in the complex plane. b) Identify the breakpoint frequencies. Enter the breakpoints in increasing order. c) Express the transfer function in the standard form: H(S) = (Tpis + 1)(Tp25 +...
Sketch the straight-line approximation Bode plot diagrams (magnitude and phase) 110s for H[s] You might want...
 Sketch the straight-line approximation Bode plot diagrams (magnitude and phase) 110s for H[s] You might want to examine Examples E.1 and E.2 in (s+10)(s+100)´ the textbook. Based on your straight-line Bode plot sketch, answer the following questions. The questions are: a. Identify the transfer function written in time constant form. b. The phase of H[s] at low frequencies is? c. The magnitude plot has what slope at low frequencies? d. The magnitude plot has what slope at high frequencies? e....
5. Draw the magnitude characteristic of the Bode plot of the following transfer function: H(s)10(10s +11...
 5. Draw the magnitude characteristic of the Bode plot of the following transfer function: H(s)10(10s +11 (S + 200)2 Identify the poles and zeros Sketch the magnitude plot. The y-axis should be in dB. The x-axis should logarithmic, but labeled in rad/sec e) f) g) Use MATLAB to draw the complete Bode plot and check your answer. h) If the input current is VIN(t)-10 cos(t+35"),what is the output voltage. Use your MATLAB Bode plot to answer this.
The Bode magnitude plot of H(o) is shown Find H(w) 0.1 10 ? (rad/s) +20 dB/decade...
 The Bode magnitude plot of H(o) is shown Find H(w) 0.1 10 ? (rad/s) +20 dB/decade -40 dB/decade
please answer all questions and show all steps 3. Draw the magnitude characteristic of the Bode...
 please answer all questions and show all steps
3. Draw the magnitude characteristic of the Bode plot of the following transfer function: Hsout20(0.1s + 1 Vin S(s1)(0.01s +1) a) ldentify the poles and zeros b) Sketch the magnitude plot. The y-axis should be in dB. The x-axis should logarithmic, but labeled in rad/sec. Use MATLAB to draw the complete Bode plot and check your answer. If the input current is uln(t)-2 cos(2t + 30%), what is the output voltage. Use...
please answer all questions and show all steps
3. Draw the magnitude characteristic of the Bode plot of the following transfer function: Hsout20(0.1s + 1 Vin S(s1)(0.01s +1) a) ldentify the poles and zeros b) Sketch the magnitude plot. The y-axis should be in dB. The x-axis should logarithmic, but labeled in rad/sec. Use MATLAB to draw the complete Bode plot and check your answer. If the input current is uln(t)-2 cos(2t + 30%), what is the output voltage. Use...
-... Find the transfer function H(w) with the Bode magnitude plot shown in Fig. 14.74 H...
 -... Find the transfer function H(w) with the Bode magnitude plot shown in Fig. 14.74 H (dB)参 20 20 dB/decade 0 -20L 2 20 100 a) (rad/s)
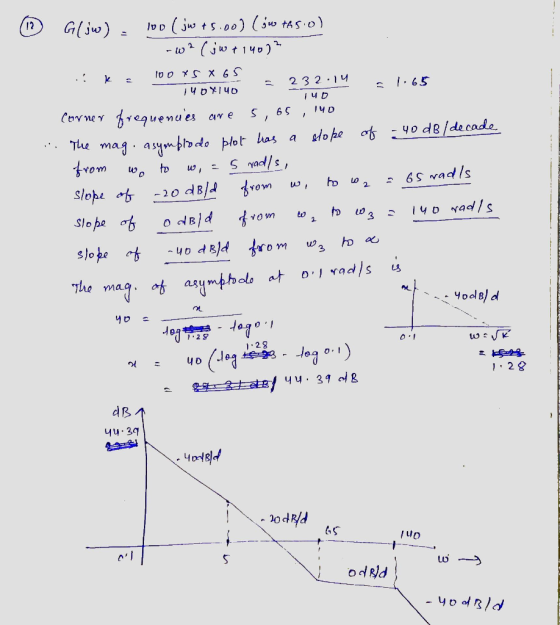
Sketch the magnitude characteristic of the Bode plot for the transfer function (3 marks) G(0) =...
 Sketch the magnitude characteristic of the Bode plot for the transfer function (3 marks) G(0) = -02.104 (jo+1)2.jw+10)-(+100)
 Chapter 12, Problem 12.21 (Multistep) Part 1 Correct. Sketch the magnitude characteristic of the Bode plot for the transfer function 30(0.060 * jo + 1) jojo + 1)(0.0024 * ja + 1) H0) = Shown here is the radian frequency axis for w > 0. The labeled frequencies represent the break frequencies in the transfer function H(o) (not necessarily drawn to scale). -+ W + w W3 W (rad/sec) What are the numerical values of the break frequencies w1, wz,...
 Chapter 12, Problem 12.13 Your answer is partially correct. Try again. Choose the correct drawing of the Bode plot for the network function 16ίώ + 1 The magnitude plot has a slope of I-20 dB/decade from us 0 to ω.10:06 rad/s, a slope of dB/decade from ool to ω2-1120.05 rad/s, and a slope of 2 20 dB/decade 70 from ω2 to co. The value of the magnitude asymptotes between ω1 and ω2 is dB. Click if you would like to...
 4. Draw the magnitude characteristic of the Bode plot of the following transfer function: 10s H (s) =-= (s+1)(s+102 L7n Identify the poles and zeros Sketch the magnitude plot. The y-axis should be in dB. The x-axis should logarithmic, but labeled in rad/sec Use MATLAB to draw the complete Bode plot and check your answer. If the input current is un(t) = 2 cos(20t + 5°), what is the output voltage. Use your MATLAB Bode plot to answer this a)...
 Hw 10 Problem 2 2. Draw the magnitude characteristic of the Bode plot of the following transfer function: HG) = (s +5)(s +10) 5 + 5 + 10) a) Identify the poles and zeros. Enter values beginning with the poles and zeros whose real parts are closest to the origin in the complex plane. b) Identify the breakpoint frequencies. Enter the breakpoints in increasing order. c) Express the transfer function in the standard form: H(S) = (Tpis + 1)(Tp25 +...
 Sketch the straight-line approximation Bode plot diagrams (magnitude and phase) 110s for H[s] You might want to examine Examples E.1 and E.2 in (s+10)(s+100)´ the textbook. Based on your straight-line Bode plot sketch, answer the following questions. The questions are: a. Identify the transfer function written in time constant form. b. The phase of H[s] at low frequencies is? c. The magnitude plot has what slope at low frequencies? d. The magnitude plot has what slope at high frequencies? e....
 5. Draw the magnitude characteristic of the Bode plot of the following transfer function: H(s)10(10s +11 (S + 200)2 Identify the poles and zeros Sketch the magnitude plot. The y-axis should be in dB. The x-axis should logarithmic, but labeled in rad/sec e) f) g) Use MATLAB to draw the complete Bode plot and check your answer. h) If the input current is VIN(t)-10 cos(t+35"),what is the output voltage. Use your MATLAB Bode plot to answer this.
 The Bode magnitude plot of H(o) is shown Find H(w) 0.1 10 ? (rad/s) +20 dB/decade -40 dB/decade
 please answer all questions and show all steps
3. Draw the magnitude characteristic of the Bode plot of the following transfer function: Hsout20(0.1s + 1 Vin S(s1)(0.01s +1) a) ldentify the poles and zeros b) Sketch the magnitude plot. The y-axis should be in dB. The x-axis should logarithmic, but labeled in rad/sec. Use MATLAB to draw the complete Bode plot and check your answer. If the input current is uln(t)-2 cos(2t + 30%), what is the output voltage. Use...
please answer all questions and show all steps
3. Draw the magnitude characteristic of the Bode plot of the following transfer function: Hsout20(0.1s + 1 Vin S(s1)(0.01s +1) a) ldentify the poles and zeros b) Sketch the magnitude plot. The y-axis should be in dB. The x-axis should logarithmic, but labeled in rad/sec. Use MATLAB to draw the complete Bode plot and check your answer. If the input current is uln(t)-2 cos(2t + 30%), what is the output voltage. Use...
 -... Find the transfer function H(w) with the Bode magnitude plot shown in Fig. 14.74 H (dB)参 20 20 dB/decade 0 -20L 2 20 100 a) (rad/s)
 Sketch the magnitude characteristic of the Bode plot for the transfer function (3 marks) G(0) = -02.104 (jo+1)2.jw+10)-(+100)
Most questions answered within 3 hours.
-
A uniform magnetic field is perpendicular to the plane of a wire
loop. If the loop...
asked 4 minutes ago -
Preparation of Benzoic Acid using a Grignard Reagent URGENT
1. During your Grignard formation, a small...
asked 5 minutes ago -
At the peak of your career, your were earning $120,000 and
holding a top level position....
asked 7 minutes ago -
. A permanent magnet is dropped south-end-down through a horizontal
circular coil with a radius of...
asked 10 minutes ago -
Bernie's Beverages purchased some fixed assets classified as
5-year property for MACRS. The assets cost $28,000....
asked 24 minutes ago -
How many ATPs are produced from the catabolism of a 10-C
molecule of fatty acid under...
asked 28 minutes ago -
Before practicing a routine on the rings, a 64.8 kg gymnast
hangs motionless, with one hand...
asked 30 minutes ago -
If the K b of a weak base is 6.3 × 10 − 6 , what...
asked 36 minutes ago -
Which of the following is the minimum amount of moles of NaOH
that must be added...
asked 40 minutes ago -
Stories about organizational ________ provide important clues
about cultural values and norms.
a. myths
b. heroes...
asked 41 minutes ago -
Explain the criteria used in selecting a target market
BUS220 Retail Management, thank you!
asked 43 minutes ago -
Convert/Calculate the following:
Determine the identity of an elemental gas if 4.55 L weighing
35.4g, under...
asked 47 minutes ago