NOTE: THIS IS VERY SIMILAR TO ANOTHER PROBLEM THAT'S ALREADY ANSWERED BUT THE VALUES ARE SLIGHTLY DIFFERENT. PLEASE PAY ATTENTION TO THE EXACT VALUES AND THE QUESTION BEING ASKED.
SOMEONE ALREADY "ANSWERED" THIS QUESTION WITH LINES OF CODE. I NEED THIS TO BE ANSWERED, STEP-BY-STEP, BY HAND
Please write legibly and show all steps.
Homework Answers
Here we are to test,
 The weights are random.
versus
 is
false
is
false
Mean of the given weights(in ounces) = 32.55
Now we form a sequence by assigning '1' to the points which are greater than the mean and '0' to the points which are less than or equal to the mean. To make the above dialect clear we can construct the following table:
| X | X-mean(X) | Number Assigned |
|
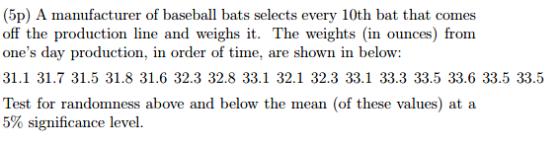
31.1 31.7 31.5 31.8 31.6 32.3 32.8 33.1 32.1 32.3 33.1 33.3 33.5 33.6 33.5 33.5 |
-1.45 -0.85 -1.05 -0.75 -0.95 -0.25 0.25 0.55 -0.45 -0.25 0.55 0.75 0.95 1.05 0.95 0.95 |
0 0 0 0 0 0 1 1 0 0 1 1 1 1 1 1 |
| Total= 520.8 |
Hence, the sequence formed is: { 0 0 0 0 0 0 1 1 0 0 1 1 1 1 1 1 }
Number of '0's =m=8
Number of '1' s=n=8
Number of runs of '0'= n1= 2
Number of runs of '1' = n2 = 2
To test  , the test statistic used is 'U' , the total number of runs.
The tabulated value of U = U(tab) = n1+n2=4
The critical value of U at 5% level of significance in this case is 4. (Using Critical values Table of a Run Test ) .Since the tabulated value of U does not exceed the critical value, we reject the Null hypothesis and conclude that the data given is not random.
Add Answer to:
NOTE: THIS IS VERY SIMILAR TO ANOTHER PROBLEM THAT'S ALREADY
ANSWERED BUT THE VALUES ARE SLIGHTLY...
Most questions answered within 3 hours.
-
At the start of a CD it is spinning at a rate of 525 rpm
(revolutions...
asked 16 minutes ago -
4. Without doing any calculations, predict whether the observed
∆T would increase, decrease or remain the...
asked 1 hour ago -
Based on the range, which of the following sets of scores has
the greatest variability? 3,...
asked 2 hours ago -
Ripples in a pond travel at a velocity of 3 m/s with one peak
passing a...
asked 2 hours ago -
A man stands on the roof of a building of height 13.0 mm and
throws a...
asked 2 hours ago -
The extent to which assets are financed by borrowed funds and
other liabilities is indicated by:...
asked 3 hours ago -
Explain in detail
Germany is the fifth largest economy
explain what goods and services Germany specializes...
asked 3 hours ago -
The density of platinum is 21.45 g/mL. If a cube of platinum
with a mass of...
asked 3 hours ago -
Accounts Receivable
Sales
A/R Posting
Extended Sales Invoice
Packing Slip
Compare invoice to packing slip 2...
asked 3 hours ago -
Michaella, age 23, is a full-time law student and is claimed by
her parents as a...
asked 4 hours ago -
Why are polymers not typically casted into products?
asked 4 hours ago -
When rolling a die 129 times, what is the probability of rolling
a 6 no more...
asked 4 hours ago