


Homework Answers

Add Answer to:
1. Graphical Analysis (6 p). Using only the D2L EXCEL data for the UNKNOWN you are...
please help with number 3 and check if my reaction order and rate constant are correct...
 please help with number 3 and check if my reaction order and
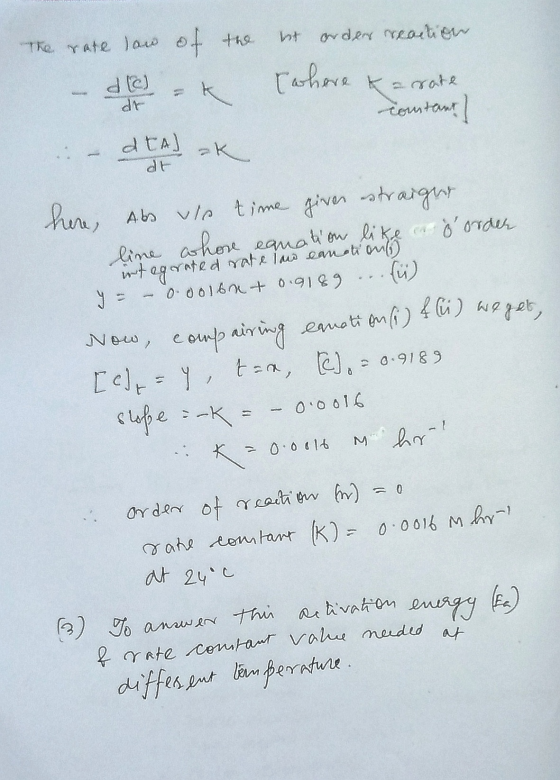
rate constant are correct for number 2 as well
1. Graphical Analysis (6 p). Using only the D2L EXCEL data for the UNKNOWN you are assigned to perform a graphical analysis. Paste-in all the graphs for a complete analysis. Include the equation of the line and the value for each Y-0.0031x+0.7184 R^2=0.9604 Lambda max(nm): 262 Molar absorbtivity (M^-1 cm ^-1): 7.19E+04 Temp (celcius): 24 abs vs time (hrs)...
please help with number 3 and check if my reaction order and
rate constant are correct for number 2 as well
1. Graphical Analysis (6 p). Using only the D2L EXCEL data for the UNKNOWN you are assigned to perform a graphical analysis. Paste-in all the graphs for a complete analysis. Include the equation of the line and the value for each Y-0.0031x+0.7184 R^2=0.9604 Lambda max(nm): 262 Molar absorbtivity (M^-1 cm ^-1): 7.19E+04 Temp (celcius): 24 abs vs time (hrs)...
. Shelf Life at 24 °C (5 p). Determine the t90 (shelf life) at 24 °C...
 . Shelf Life at 24 °C (5 p). Determine the
t90 (shelf life) at 24 °C for your unknown.
Show all work. First, symbolically state the equation(s)
you are using defining all variables.
rate constant (k) = -0.0016 M^-1s^-1
[C]o=initial concentration: 0.9228
It is a zero order reaction
Abs vs Time 1.000 0.900 0.800 Abs 0.500 y = -0.0016x +0.9189 R = 0.9962 0.400 0.300 0.200 0.100 0.000 50 200 250 100 150 Time (hours)
. Shelf Life at 24 °C (5 p). Determine the
t90 (shelf life) at 24 °C for your unknown.
Show all work. First, symbolically state the equation(s)
you are using defining all variables.
rate constant (k) = -0.0016 M^-1s^-1
[C]o=initial concentration: 0.9228
It is a zero order reaction
Abs vs Time 1.000 0.900 0.800 Abs 0.500 y = -0.0016x +0.9189 R = 0.9962 0.400 0.300 0.200 0.100 0.000 50 200 250 100 150 Time (hours)
1. Based on the elemental analysis for the unknown organic compound, calculate the empirical formula. If...
 1. Based on the elemental analysis for the unknown
organic compound, calculate the empirical formula. If compound
contains an unknown element (X), briefly explain how you identified
which element it is.
2. Determine molecular formula for unknown compound and explain
answer.
3. Based on molecular formulary, calculate degree of saturation
present in unknown organic compound.
4. Clearly label molecular ion peak and base peak directly on the
mass spectrum and draw structures corresponding to these
icons.
5. identify at least...
1. Based on the elemental analysis for the unknown
organic compound, calculate the empirical formula. If compound
contains an unknown element (X), briefly explain how you identified
which element it is.
2. Determine molecular formula for unknown compound and explain
answer.
3. Based on molecular formulary, calculate degree of saturation
present in unknown organic compound.
4. Clearly label molecular ion peak and base peak directly on the
mass spectrum and draw structures corresponding to these
icons.
5. identify at least...
MULTIPLE CHOICE. Choose the one alternative that best completes the statement or answers the question. 1)...
MULTIPLE CHOICE. Choose the one alternative that best completes the statement or answers the question. 1) The LM curve represents A) the single level of output where the goods market is in equilibrium. B) the combinations of output and the interest rate where the goods market is in equilibrium. C) the single level of output where financial markets are in equilibrium. D) the combinations of output and the interest rate where the money market is in equilibrium. E) none of...
MULTIPLE CHOICE. Choose the one alternative that best completes the statement or answers the question. 1) The...
MULTIPLE CHOICE. Choose the one alternative that best completes the statement or answers the question. 1) The LM curve represents A) the single level of output where the goods market is in equilibrium. B) the combinations of output and the interest rate where the goods market is in equilibrium. C) the single level of output where financial markets are in equilibrium. D) the combinations of output and the interest rate where the money market is in equilibrium. E) none of the...
 please help with number 3 and check if my reaction order and
rate constant are correct for number 2 as well
1. Graphical Analysis (6 p). Using only the D2L EXCEL data for the UNKNOWN you are assigned to perform a graphical analysis. Paste-in all the graphs for a complete analysis. Include the equation of the line and the value for each Y-0.0031x+0.7184 R^2=0.9604 Lambda max(nm): 262 Molar absorbtivity (M^-1 cm ^-1): 7.19E+04 Temp (celcius): 24 abs vs time (hrs)...
please help with number 3 and check if my reaction order and
rate constant are correct for number 2 as well
1. Graphical Analysis (6 p). Using only the D2L EXCEL data for the UNKNOWN you are assigned to perform a graphical analysis. Paste-in all the graphs for a complete analysis. Include the equation of the line and the value for each Y-0.0031x+0.7184 R^2=0.9604 Lambda max(nm): 262 Molar absorbtivity (M^-1 cm ^-1): 7.19E+04 Temp (celcius): 24 abs vs time (hrs)...
 . Shelf Life at 24 °C (5 p). Determine the
t90 (shelf life) at 24 °C for your unknown.
Show all work. First, symbolically state the equation(s)
you are using defining all variables.
rate constant (k) = -0.0016 M^-1s^-1
[C]o=initial concentration: 0.9228
It is a zero order reaction
Abs vs Time 1.000 0.900 0.800 Abs 0.500 y = -0.0016x +0.9189 R = 0.9962 0.400 0.300 0.200 0.100 0.000 50 200 250 100 150 Time (hours)
. Shelf Life at 24 °C (5 p). Determine the
t90 (shelf life) at 24 °C for your unknown.
Show all work. First, symbolically state the equation(s)
you are using defining all variables.
rate constant (k) = -0.0016 M^-1s^-1
[C]o=initial concentration: 0.9228
It is a zero order reaction
Abs vs Time 1.000 0.900 0.800 Abs 0.500 y = -0.0016x +0.9189 R = 0.9962 0.400 0.300 0.200 0.100 0.000 50 200 250 100 150 Time (hours)
 1. Based on the elemental analysis for the unknown
organic compound, calculate the empirical formula. If compound
contains an unknown element (X), briefly explain how you identified
which element it is.
2. Determine molecular formula for unknown compound and explain
answer.
3. Based on molecular formulary, calculate degree of saturation
present in unknown organic compound.
4. Clearly label molecular ion peak and base peak directly on the
mass spectrum and draw structures corresponding to these
icons.
5. identify at least...
1. Based on the elemental analysis for the unknown
organic compound, calculate the empirical formula. If compound
contains an unknown element (X), briefly explain how you identified
which element it is.
2. Determine molecular formula for unknown compound and explain
answer.
3. Based on molecular formulary, calculate degree of saturation
present in unknown organic compound.
4. Clearly label molecular ion peak and base peak directly on the
mass spectrum and draw structures corresponding to these
icons.
5. identify at least...
Most questions answered within 3 hours.
-
This java code won't run and I can't figure out the problem with
it. Please help...
asked 1 minute ago -
Trace the following recursive methods:
a) isPal with the string “abccda”
b) isAnBn with the string...
asked 1 hour ago -
1. Which of the following is false about photosynthesis?
A. ATP is the molecule used to...
asked 1 hour ago -
A simple random sample of size n=64 is obtained from a
population with a mean of...
asked 2 hours ago -
(2 dimensions, 1 object, 2 accelerations)
1) A projectile is thrown with a wind. The wind...
asked 3 hours ago -
Brian makes $34,100 per year. How much can Brian expect to
contribute to FICA taxes in...
asked 4 hours ago -
To buy a new house you must borrow $155,000. To do this you take
out a...
asked 4 hours ago -
Spacely Sprockets is evaluating the construction of a new plant
on land the company purchased for...
asked 5 hours ago -
1. Consider a linear regression model of y on K regressors and
an intercept.
(i) Describe...
asked 5 hours ago -
Enter a balanced equation for the reaction between hydrochloric
acid and sodium sulfite.
Express your answer...
asked 5 hours ago -
Give a regular expression describing the language
{x | x ∈ Σ* and x does not...
asked 5 hours ago -
Masses of 1.0 kg, 2.0 kg, and 3.0 kg are each separately subject
to a net...
asked 5 hours ago