Let x be the average number of employees in a group health insurance plan, and let...
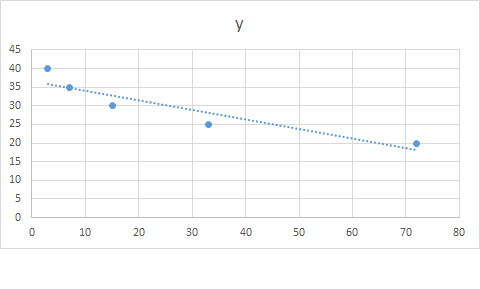
Let x be the average number of employees in a group health insurance plan, and let y be the average administrative cost as a percentage of claims.
x 3 7 15 33 72 y 40 35 30 25 20
(a) Make a scatter diagram of the data and visualize the line you think best fits the data. Get Flash Player Flash Player version 10 or higher is required for this question. You can get Flash Player free from Adobe's website.
(b) Would you say the correlation is low, moderate, or strong? positive or negative? moderate and negative low and negative moderate and positive strong and negative strong and positive low and positive
(c) Use a calculator to verify that Σx = 130, Σx2 = 6556, Σy = 150, Σy2 = 4750, and Σxy = 3080. Compute r. (Round your answer to three decimal places.) r =
As x increases, does the value of r imply that y should tend to increase or decrease? Explain. Given our value of r, y should tend to decrease as x increases. Given our value of r, we cannot draw any conclusions for the behavior of y as x increases. Given our value of r, y should tend to remain constant as x increases. Given our value of r, y should tend to increase as x increases.
Homework Answers
Ans:
a)
b)strong,negative
c)
r=(5*3080-130*150)/SQRT((5*6556-130^2)*(5*4750-150^2))=-0.920
Given our value of r, y should tend to decrease as x increases.
Add Answer to:
Let x be the average number of employees in a group health
insurance plan, and let...
Let x be the average number of employees in a group health insurance plan, and let...
Let x be the average number of employees in a group health insurance plan, and let y be the average administrative cost as a percentage of claims. x 3 7 15 36 72 y 40 35 30 26 21 (a) Make a scatter diagram of the data and visualize the line you think best fits the data. You can get Flash Player free from Adobe's website. (b) Would you say the correlation is low, moderate, or strong? positive or negative?...
Let x be the average number of employees in a group health insurance plan, and let...
Let x be the average number of employees in a group health insurance plan, and let y be the average administrative cost as a percentage of claims. x 3 7 15 33 74 y 40 35 30 26 16 (b) Would you say the correlation is low, moderate, or strong? positive or negative? moderate and positive strong and negative moderate and negative low and negative strong and positive low and positive (c) Use a calculator to verify that Σx =...
Let x be the average number of employees in a group health insurance plan, and let...
Let x be the average number of employees in a group health insurance plan, and let y be the average administrative cost as a percentage of claims. x 3 7 15 36 73 y 40 35 30 28 20 (a) Make a scatter diagram of the data and visualize the line you think best fits the data. Submission Data (b) Would you say the correlation is low, moderate, or strong? positive or negative? strong and positive low and negative low...
Let x be the average number of employees in a group health insurance plan, and let...
Let x be the average number of employees in a group health insurance plan, and let y be the average administrative cost as a percentage of claims. x 3 7 15 38 70 y 40 35 30 26 17 (a) Make a scatter diagram of the data and visualize the line you think best fits the data. (b) Would you say the correlation is low, moderate, or strong? positive or negative? strong and positive low and negative strong and negative...
Let x be the average number of employees in a group health insurance plan, and let...
Let x be the average number of employees in a group health insurance plan, and let y be the average administrative cost as a percentage of claims. x 3 7 15 38 73 y 40 35 30 28 20 (a) Make a scatter diagram of the data and visualize the line you think best fits the data. (b) Would you say the correlation is low, moderate, or strong? positive or negative? strong and positivestrong and negative low and negativemoderate and negativelow...
Let x be the average number of employees in a group health insurance plan, and let...
 Let x be the average number of employees in a group
health insurance plan, and let y be the average
administrative cost as a percentage of claims.
x
3
7
15
36
72
y
40
35
30
26
16
(b) Would you say the correlation is low, moderate, or strong? positive or negative? low and negative moderate and positive strong and negative moderate and negative low and positive strong and positive (c) Use a calculator to verify that ΣΧ-133, ΣΧ2-6763,2y-147,...
Let x be the average number of employees in a group
health insurance plan, and let y be the average
administrative cost as a percentage of claims.
x
3
7
15
36
72
y
40
35
30
26
16
(b) Would you say the correlation is low, moderate, or strong? positive or negative? low and negative moderate and positive strong and negative moderate and negative low and positive strong and positive (c) Use a calculator to verify that ΣΧ-133, ΣΧ2-6763,2y-147,...
Is the magnitude of an earthquake related to the depth below the surface at which the...
Is the magnitude of an earthquake related to the depth below the surface at which the quake occurs? Let x be the magnitude of an earthquake (on the Richter scale), and let y be the depth (in kilometers) of the quake below the surface at the epicenter. x 3.5 4.4 3.3 4.5 2.6 3.2 3.4 y 4.5 10.4 11.2 10.0 7.9 3.9 5.5 (a) Make a scatter diagram of the data. Get Flash Player Flash Player version 10 or higher...
Ignore the Adobe Flash Player Part How much should a healthy Shetland pony weigh? Let x...
 Ignore the Adobe Flash Player Part
How much should a healthy Shetland pony weigh? Let x be the age of the pony (in months), and let y be the average weight of the pony (in kilograms) 3 60 95 6 14 140 170 187 12 26 (a) Make a scatter diagram of the data and visualize the line you think best fits the data Get ADOBE FLASH PLAYER Flash Player version 10 or higher is required for this question You...
Ignore the Adobe Flash Player Part
How much should a healthy Shetland pony weigh? Let x be the age of the pony (in months), and let y be the average weight of the pony (in kilograms) 3 60 95 6 14 140 170 187 12 26 (a) Make a scatter diagram of the data and visualize the line you think best fits the data Get ADOBE FLASH PLAYER Flash Player version 10 or higher is required for this question You...
Let x be the average number of employees in a group health insurance plan, and let...
Let x be the average number of employees in a group health insurance plan, and let y be the average administrative cost as a percentage of claims. x 3 7 15 32 70 y 40 35 30 26 18 Use a calculator to verify that Σx = 127, Σx2 = 6207, Σy = 149, Σy2 = 4725, and Σxy = 2907. Compute r. (Round your answer to three decimal places.) r = 3
It is thought that basketball teams that make too many fouls in a game tend to lose the game even if they otherwise play well. Let x be the number of fouls more than (i.e., over and above) the opposin...
It is thought that basketball teams that make too many fouls in a game tend to lose the game even if they otherwise play well. Let x be the number of fouls more than (i.e., over and above) the opposing team. Let y be the percentage of times the team with the larger number of fouls wins the game. x 1 2 5 6 y 48 42 33 26 Complete parts (a) through (e), given Σx = 14, Σy =...
 Let x be the average number of employees in a group
health insurance plan, and let y be the average
administrative cost as a percentage of claims.
x
3
7
15
36
72
y
40
35
30
26
16
(b) Would you say the correlation is low, moderate, or strong? positive or negative? low and negative moderate and positive strong and negative moderate and negative low and positive strong and positive (c) Use a calculator to verify that ΣΧ-133, ΣΧ2-6763,2y-147,...
Let x be the average number of employees in a group
health insurance plan, and let y be the average
administrative cost as a percentage of claims.
x
3
7
15
36
72
y
40
35
30
26
16
(b) Would you say the correlation is low, moderate, or strong? positive or negative? low and negative moderate and positive strong and negative moderate and negative low and positive strong and positive (c) Use a calculator to verify that ΣΧ-133, ΣΧ2-6763,2y-147,...
 Ignore the Adobe Flash Player Part
How much should a healthy Shetland pony weigh? Let x be the age of the pony (in months), and let y be the average weight of the pony (in kilograms) 3 60 95 6 14 140 170 187 12 26 (a) Make a scatter diagram of the data and visualize the line you think best fits the data Get ADOBE FLASH PLAYER Flash Player version 10 or higher is required for this question You...
Ignore the Adobe Flash Player Part
How much should a healthy Shetland pony weigh? Let x be the age of the pony (in months), and let y be the average weight of the pony (in kilograms) 3 60 95 6 14 140 170 187 12 26 (a) Make a scatter diagram of the data and visualize the line you think best fits the data Get ADOBE FLASH PLAYER Flash Player version 10 or higher is required for this question You...
Most questions answered within 3 hours.
-
In Drosophila, the transition from the syncytial blastoderm
stage to the cellular blastoderm stage is a...
asked 10 minutes ago -
Project management question:
Name 3 different types of resources (hint: humans are one
type)
asked 23 minutes ago -
Consider the following reaction: C 2H 2( g) + 2H 2( g) C 2H 6(
g)...
asked 30 minutes ago -
Consider a 1.0 L buffer containing 0.092 mol L-1 HCOOH and 0.100
mol L-1 HCOO-. What...
asked 39 minutes ago -
Koch Realty has owned a vacant land with a FMV of
$775,000 and an adjusted basis...
asked 45 minutes ago -
It is estimated 29% of all adults in United States invest in
stocks and that 85%...
asked 45 minutes ago -
What does a 2-sided p value of 0.04 mean? (I am not asking if it
is...
asked 59 minutes ago -
A parallel-plate capacitor is made from two aluminum-foil
sheets, each 7.8 cmcm wide and 5.1 mmlong....
asked 1 hour ago -
1. why is toluene a stronger nucleophile than benzene?
2.why is phenol a stronger nucleophile than...
asked 1 hour ago -
4. How can you solve for the density of the liquid from the
slope? Please show...
asked 1 hour ago -
when 2053 j of heat is added to 46.3 g of hexane C6H14 the
temperature increases...
asked 1 hour ago -
I need new and unique answers, please. (Use your own words,
don't copy and paste), Please...
asked 1 hour ago