Car engine displacement in liters and fuel consumption for combined city/highway in miles per gallon (MPG)....
| Car engine displacement in liters and fuel consumption for combined city/highway in miles per gallon (MPG). | ||||||||||||||
| This data is from 2015 Fuel Economy Guide for the Department of Energy (DOE) | ||||||||||||||
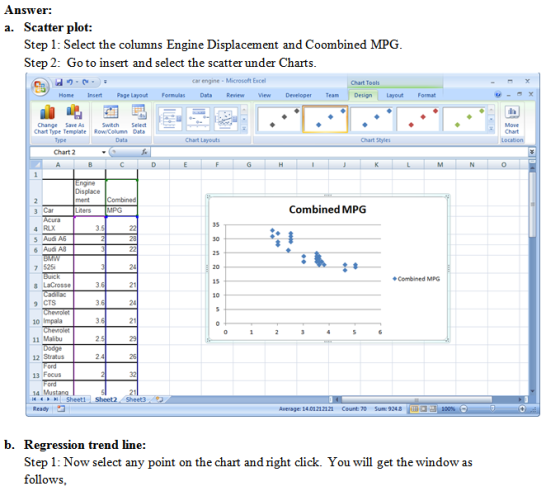
| Engine | a. Make a scatterplot of the car MPG by displacement from the data in columns B and C. | |||||||||||||
| Displacement | Combined | Be sure the scatterplot contains the 5 important points of a chart or graph. | ||||||||||||
| Car | Liters | MPG | ||||||||||||
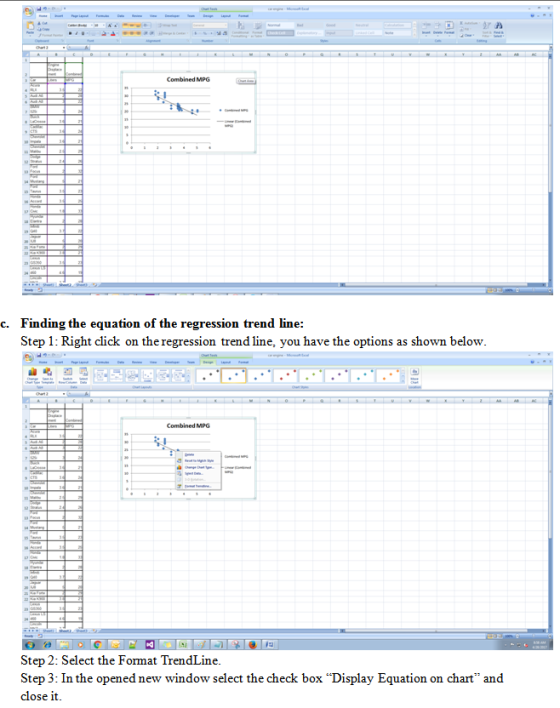
| Acura RLX | 3.5 | 22.0 | b. Place the regression trend line on the scatterplot. | |||||||||||
| Audi A6 | 2.0 | 28.0 | ||||||||||||
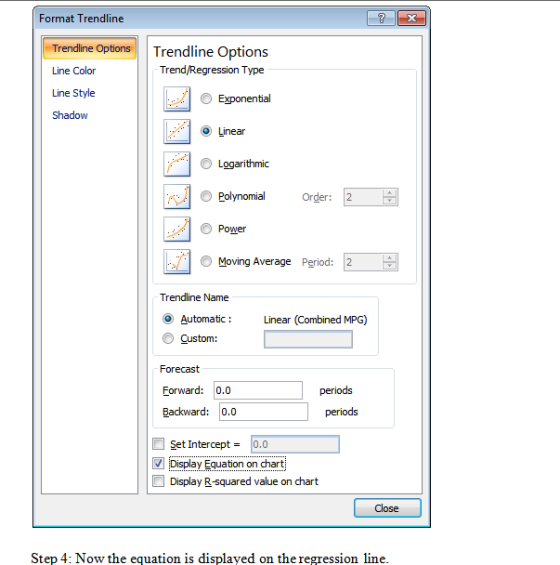
| Audi A8 | 3.0 | 22.0 | c. Find the equation of the regression line for predicting car MPG from displacement in liters. | |||||||||||
| BMW 525i | 3.0 | 24.0 | ||||||||||||
| Buick LaCrosse | 3.6 | 21.0 | d. Find the correlation for the data in this scatterplot. | |||||||||||
| Cadillac CTS | 3.6 | 24.0 | ||||||||||||
| Chevrolet Impala | 3.6 | 21.0 | e. Find the α = .05 critical value. Is this a valid correlation? | |||||||||||
| Chevrolet Malibu | 2.5 | 29.0 | ||||||||||||
| Dodge Stratus | 2.4 | 26.0 | f. You are interested in fuel economy and are looking at car with an engine displacement of 0.698 liters (Smart Car). | |||||||||||
| Ford Focus | 2.0 | 32.0 | What would be the predicted combined MPG for such a car? | |||||||||||
| Ford Mustang | 5.0 | 21.0 | Can we trust this prediction? | Why? Or Why not? | ||||||||||
| Ford Taurus | 3.5 | 23.0 | ||||||||||||
| Honda Accord | 3.5 | 25.0 | g. What proportion of the variation in the combined MPG can be explained by the linear relationship | |||||||||||
| Honda Civic | 1.8 | 33.0 | between MPG and engine displacement? | |||||||||||
| Hyundai Elantra | 2.0 | 28.0 | ||||||||||||
| Infiniti Q40 | 3.7 | 22.0 | h. For every one liter increase in engine displacement how much will the MPG change? | |||||||||||
| Jaguar XJ8 | 5.0 | 20.0 | ||||||||||||
| Kia Forte | 2.0 | 29.0 | ||||||||||||
| Kia K900 | 3.8 | 21.0 | ||||||||||||
| Lexus GS350 | 3.5 | 23.0 | ||||||||||||
| Lexus LS 460 | 4.6 | 19.0 | ||||||||||||
| Lincoln MKZ | 3.7 | 22.0 | ||||||||||||
| Mazda 3 | 2.5 | 32.0 | ||||||||||||
| Mercedes-Benz E350 | 3.5 | 23.0 | ||||||||||||
| Mercury Grand Marquis | 4.6 | 21.0 | ||||||||||||
| Mitsubishi Lancer | 2.4 | 26.0 | ||||||||||||
| Nissan Altima | 2.5 | 31.0 | ||||||||||||
| Subaru Legacy | 2.5 | 30.0 | ||||||||||||
| Subaru Outback | 3.6 | 22.0 | ||||||||||||
| Toyota Avalon | 3.5 | 24.0 | ||||||||||||
| Toyota Corolla | 1.8 | 31.0 | ||||||||||||
| Volkswagon Passat | 3.6 | 23.0 | ||||||||||||
| Volvo S80 | 3.0 | 22.0 | ||||||||||||
Homework Answers


Add Answer to:
Car engine
displacement in liters and fuel consumption for combined
city/highway in miles per gallon (MPG)....
Sports car or convertible? The following table presents the fuel efficiency, in miles per gallon, for...
 Sports car or convertible? The following table presents the fuel efficiency, in miles per gallon, for a sample of convertibles and a sample of sports cars. Convertible Model MPG Sports Model MPG BMW 328i Mitsubishi Lancer Evolution Toyota Camry Solara Ford Mustang V6 Volkswagen Eos MINI Cooper Saab 9-3 Volkswagen GTI Honda Civic Si BMW 135i 23 Mazda Mazdaspeed Subaru Impreza WRX STI 24 Send date to Excel Part 1 of 2 Part 2 of 2 (b) Find the sample...
The case involves predicting the value score of a car based on the price of the car, five-year co...
 Note: I just need part 6a&b
The case involves predicting the value score of a car based on the price of the car, five-year cost/mile, road-test score, and predicted reliability. A car with a value score of 1.0 is considered to be "average- value." A car with a value score of 2.0 is considered to be twice as good a value as a car with a value score of 1.0; a car with a value score of 0.5 is considered...
Note: I just need part 6a&b
The case involves predicting the value score of a car based on the price of the car, five-year cost/mile, road-test score, and predicted reliability. A car with a value score of 1.0 is considered to be "average- value." A car with a value score of 2.0 is considered to be twice as good a value as a car with a value score of 1.0; a car with a value score of 0.5 is considered...
a.Create a scatterplot for the data in the Length (in inches) and Braking Distance (in feet)...
 a.Create a scatterplot for the
data in the Length (in inches) and Braking Distance (in feet)
columns. b.calculate the linear correlation between the data in the
Length and Braking Distance columns. c) Explain the mathematical
relationship between Length and Braking Distance based on the
linear correlation coefficient. d) Create a scatterplot for the
data in Displacement (in liters) and Highway MPG columns. E.
calculate the linear correlation coefficient between the data in
the Displacement and Highway MPG columns. f) Compare...
a.Create a scatterplot for the
data in the Length (in inches) and Braking Distance (in feet)
columns. b.calculate the linear correlation between the data in the
Length and Braking Distance columns. c) Explain the mathematical
relationship between Length and Braking Distance based on the
linear correlation coefficient. d) Create a scatterplot for the
data in Displacement (in liters) and Highway MPG columns. E.
calculate the linear correlation coefficient between the data in
the Displacement and Highway MPG columns. f) Compare...
 Sports car or convertible? The following table presents the fuel efficiency, in miles per gallon, for a sample of convertibles and a sample of sports cars. Convertible Model MPG Sports Model MPG BMW 328i Mitsubishi Lancer Evolution Toyota Camry Solara Ford Mustang V6 Volkswagen Eos MINI Cooper Saab 9-3 Volkswagen GTI Honda Civic Si BMW 135i 23 Mazda Mazdaspeed Subaru Impreza WRX STI 24 Send date to Excel Part 1 of 2 Part 2 of 2 (b) Find the sample...
 Note: I just need part 6a&b
The case involves predicting the value score of a car based on the price of the car, five-year cost/mile, road-test score, and predicted reliability. A car with a value score of 1.0 is considered to be "average- value." A car with a value score of 2.0 is considered to be twice as good a value as a car with a value score of 1.0; a car with a value score of 0.5 is considered...
Note: I just need part 6a&b
The case involves predicting the value score of a car based on the price of the car, five-year cost/mile, road-test score, and predicted reliability. A car with a value score of 1.0 is considered to be "average- value." A car with a value score of 2.0 is considered to be twice as good a value as a car with a value score of 1.0; a car with a value score of 0.5 is considered...
 a.Create a scatterplot for the
data in the Length (in inches) and Braking Distance (in feet)
columns. b.calculate the linear correlation between the data in the
Length and Braking Distance columns. c) Explain the mathematical
relationship between Length and Braking Distance based on the
linear correlation coefficient. d) Create a scatterplot for the
data in Displacement (in liters) and Highway MPG columns. E.
calculate the linear correlation coefficient between the data in
the Displacement and Highway MPG columns. f) Compare...
a.Create a scatterplot for the
data in the Length (in inches) and Braking Distance (in feet)
columns. b.calculate the linear correlation between the data in the
Length and Braking Distance columns. c) Explain the mathematical
relationship between Length and Braking Distance based on the
linear correlation coefficient. d) Create a scatterplot for the
data in Displacement (in liters) and Highway MPG columns. E.
calculate the linear correlation coefficient between the data in
the Displacement and Highway MPG columns. f) Compare...
Most questions answered within 3 hours.
-
PLEASE do not use any loops for the program; only recursion is
allowed
4. Write a...
asked 15 minutes ago -
Please help me with me. I did the first part to write the operations but in...
asked 12 minutes ago -
A nozzle with a radius of 0.250 cm is attached to a garden hose
with a...
asked 7 minutes ago -
Use Cryptool to find the Cryptographic SHA-1 hash value of the
string "abc". The calculator is...
asked 17 minutes ago -
You are attempting to calculate a firm’s free cash flow to
equity. You know the following...
asked 1 hour ago -
the following reaction occurs in a balloon containing
N2O2 gas
N2O4(g)=2NO2(g)
will the volume of the...
asked 1 hour ago -
answer the questions throughout this program
public class Day implements Comparable {
Private Boolean atWork;...
asked 1 hour ago -
This is C++ code for parking fee management program
#include <iostream>
#include <iomanip>
using namespace std;...
asked 2 hours ago -
The free energy change for the following reaction at 25 °C, when
[Sn2+] = 1.17 M...
asked 3 hours ago -
An MNE is this kind of industry when competition in one country
is essentially independent of...
asked 5 hours ago -
. For this set of questions, determine what
proportion of a normal distribution is located betweeneach...
asked 5 hours ago -
A college student is employed as a door-to-door newspaper
salesman. Historical data suggests that the student...
asked 6 hours ago