Please answer all of the following.


Homework Answers

Add Answer to:
Please answer all of the following.
The boxplot below shows the number of contacts in their...
please answer number 6. 7. and 8. only Birthweight for girls was compared to boys in...
 please answer number 6. 7. and 8. only
Birthweight for girls was compared to boys in the month of July in MoristoWn Hospital. S. Boys: 8, 6, 4, 7, 8, 9, 10, 7, 8, 7, 5, 4, 8, 8 and 9 lbs 4, 6, 7, 8, 10, 9, 8, 4, 5, 8, 4, 6, 7,9 and 9 lbs Girs: Describe the data for both sets: Girls Вoys 7,2 6.9 7 Меan Median 4,1.9 Mode Standard Deviation (sample) Q1 Q3 Skewness...
please answer number 6. 7. and 8. only
Birthweight for girls was compared to boys in the month of July in MoristoWn Hospital. S. Boys: 8, 6, 4, 7, 8, 9, 10, 7, 8, 7, 5, 4, 8, 8 and 9 lbs 4, 6, 7, 8, 10, 9, 8, 4, 5, 8, 4, 6, 7,9 and 9 lbs Girs: Describe the data for both sets: Girls Вoys 7,2 6.9 7 Меan Median 4,1.9 Mode Standard Deviation (sample) Q1 Q3 Skewness...
Please show all work step by step! and round answers to 4 decimal places. 4. A...
 Please show all work step by step! and round answers to 4
decimal places.
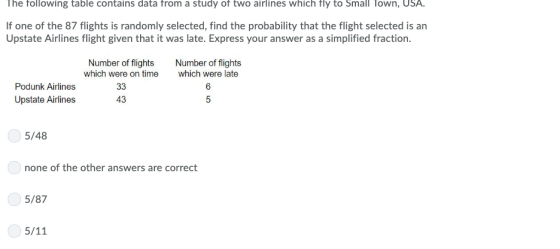
4. A department store has daily mean sales of $ 28,372.72. The standard deviation of sales is $2000. On Tuesday, the store sold $34,885.21 worth of goods. Find Tuesday's z score. 5. The following table contains data from a study of two airlines which fly to Small Town, USA. If one flight is is selected, find the probability that the flight was on time or Upstate...
Please show all work step by step! and round answers to 4
decimal places.
4. A department store has daily mean sales of $ 28,372.72. The standard deviation of sales is $2000. On Tuesday, the store sold $34,885.21 worth of goods. Find Tuesday's z score. 5. The following table contains data from a study of two airlines which fly to Small Town, USA. If one flight is is selected, find the probability that the flight was on time or Upstate...
If a histogram is constructed from the following frequency distribution, how many classes will (1 point)...
 If a histogram is constructed from the following frequency distribution, how many classes will (1 point) it have? Age Frequency 20 23 30 54 40 75 50 32 60 54 70 67 80 87 80 10 o 20 9. Identify a potentially misleading characteristic of a bar graph. (l poi) O one scale begins at some value other than zero O both scales begin at zero there are gaps between the bars there are no gaps between the bars 10....
A researcher studies water clarity at the same location in a lake on the same dates...
 A researcher studies water clarity at the same location in a lake on the same dates during the course of a year and repeats the measurements on the same dates 5 years later. The researcher immerses a weighted disk painted black and white and measures the depth (in inches) at which it is no longer visible. The collected data is given in the table below. Complete parts (a) through (c) below. Observation 1 2 3 5 6 Date 1/25 3/195/30...
A researcher studies water clarity at the same location in a lake on the same dates...
 A researcher studies water clarity at the same location in a lake on the same dates during the course of a year and repeats the measurements on the same dates 5 years later. The researcher immerses a weighted disk painted black and white and measures the depth (in inches) at which it is no longer visible. The collected data is given in the table below. Complete parts (a) through (c) below. Observation 1 2 3 5 6 Date 125 3/195/307/39/13...
all part of one question please answer all. only answer please if our positive of the...
 all part of one question
please answer all. only answer please if our positive of the
answer
4. Alpha level and the critical region Aa Aa The alpha level that a researcher sets at the beginning of the experiment is the level to which she wishes to limit the probability of making the error of rejecting the null hypothesis when it is true rejecting the null hypothesis when it is true not rejecting the null hypothesis when it is false...
all part of one question
please answer all. only answer please if our positive of the
answer
4. Alpha level and the critical region Aa Aa The alpha level that a researcher sets at the beginning of the experiment is the level to which she wishes to limit the probability of making the error of rejecting the null hypothesis when it is true rejecting the null hypothesis when it is true not rejecting the null hypothesis when it is false...
please help with all. In the following probability distribution, the random variable x represents the number...
 please help with all.
In the following probability distribution, the random variable x represents the number of activities a parent of a 6th-to 8th grade student is involved in. Complete parts (a) through (1) below. * 1 0 1 2 3 4 5 P(x) 0.269 0 206 0.224 0.239 0.062 (a) Verify that this is a discrete probability distribution This is a discrete probability distribution because the sum of the probabilities is and each probability is (6) Graph the discrete...
please help with all.
In the following probability distribution, the random variable x represents the number of activities a parent of a 6th-to 8th grade student is involved in. Complete parts (a) through (1) below. * 1 0 1 2 3 4 5 P(x) 0.269 0 206 0.224 0.239 0.062 (a) Verify that this is a discrete probability distribution This is a discrete probability distribution because the sum of the probabilities is and each probability is (6) Graph the discrete...
Need help asap!!! You are given the following dataset about the number of hours spent at...
 Need help asap!!!
You are given the following dataset about the number of hours spent at the library on one day. 1.05 1.051.08 1.10 1.11 1.13 1.18 1.20 1.20 1.24 1.28 1.34 1.45 1.50 1.52 1.90 1.99 2.55 1.09 1.09 1.14 1.16 1.23 1.24 1.38 1.39 1.53 1.86 3.03 4.19 1. Using your dataset, make a frequency distribution table that displays intervals. Fill in the table below. Start your interval at 1.00. Use 2 decimals to help make your intervals,...
Need help asap!!!
You are given the following dataset about the number of hours spent at the library on one day. 1.05 1.051.08 1.10 1.11 1.13 1.18 1.20 1.20 1.24 1.28 1.34 1.45 1.50 1.52 1.90 1.99 2.55 1.09 1.09 1.14 1.16 1.23 1.24 1.38 1.39 1.53 1.86 3.03 4.19 1. Using your dataset, make a frequency distribution table that displays intervals. Fill in the table below. Start your interval at 1.00. Use 2 decimals to help make your intervals,...
PLEASE ANSWER ALL PARTS The mean number of English courses taken in a two-year time period...
PLEASE ANSWER ALL PARTS The mean number of English courses taken in a two-year time period by male and female college students is believed to be about the same. An experiment is conducted and data are collected from 29 males and 16 females. The males took an average of four English courses with a standard deviation of 0.8. The females took an average of five English courses with a standard deviation of 1.1. Are the means statistically the same? (Use...
Can someone help with this problems please 1. (10 pts] Suppose that for a given term,...
 Can someone help with this problems please
1. (10 pts] Suppose that for a given term, data is collected on the types of courses that SPSCC students take with an interest in online and evening courses. Answer the following questions using the distribution of students below. Online Course No Online Course Totals Evening Course 28 42 70 No Evening Course 82 200 282 Totals 110 242 352 a. What is the probability a student is taking an online course? b....
Can someone help with this problems please
1. (10 pts] Suppose that for a given term, data is collected on the types of courses that SPSCC students take with an interest in online and evening courses. Answer the following questions using the distribution of students below. Online Course No Online Course Totals Evening Course 28 42 70 No Evening Course 82 200 282 Totals 110 242 352 a. What is the probability a student is taking an online course? b....
 please answer number 6. 7. and 8. only
Birthweight for girls was compared to boys in the month of July in MoristoWn Hospital. S. Boys: 8, 6, 4, 7, 8, 9, 10, 7, 8, 7, 5, 4, 8, 8 and 9 lbs 4, 6, 7, 8, 10, 9, 8, 4, 5, 8, 4, 6, 7,9 and 9 lbs Girs: Describe the data for both sets: Girls Вoys 7,2 6.9 7 Меan Median 4,1.9 Mode Standard Deviation (sample) Q1 Q3 Skewness...
please answer number 6. 7. and 8. only
Birthweight for girls was compared to boys in the month of July in MoristoWn Hospital. S. Boys: 8, 6, 4, 7, 8, 9, 10, 7, 8, 7, 5, 4, 8, 8 and 9 lbs 4, 6, 7, 8, 10, 9, 8, 4, 5, 8, 4, 6, 7,9 and 9 lbs Girs: Describe the data for both sets: Girls Вoys 7,2 6.9 7 Меan Median 4,1.9 Mode Standard Deviation (sample) Q1 Q3 Skewness...
 Please show all work step by step! and round answers to 4
decimal places.
4. A department store has daily mean sales of $ 28,372.72. The standard deviation of sales is $2000. On Tuesday, the store sold $34,885.21 worth of goods. Find Tuesday's z score. 5. The following table contains data from a study of two airlines which fly to Small Town, USA. If one flight is is selected, find the probability that the flight was on time or Upstate...
Please show all work step by step! and round answers to 4
decimal places.
4. A department store has daily mean sales of $ 28,372.72. The standard deviation of sales is $2000. On Tuesday, the store sold $34,885.21 worth of goods. Find Tuesday's z score. 5. The following table contains data from a study of two airlines which fly to Small Town, USA. If one flight is is selected, find the probability that the flight was on time or Upstate...
 If a histogram is constructed from the following frequency distribution, how many classes will (1 point) it have? Age Frequency 20 23 30 54 40 75 50 32 60 54 70 67 80 87 80 10 o 20 9. Identify a potentially misleading characteristic of a bar graph. (l poi) O one scale begins at some value other than zero O both scales begin at zero there are gaps between the bars there are no gaps between the bars 10....
 A researcher studies water clarity at the same location in a lake on the same dates during the course of a year and repeats the measurements on the same dates 5 years later. The researcher immerses a weighted disk painted black and white and measures the depth (in inches) at which it is no longer visible. The collected data is given in the table below. Complete parts (a) through (c) below. Observation 1 2 3 5 6 Date 1/25 3/195/30...
 A researcher studies water clarity at the same location in a lake on the same dates during the course of a year and repeats the measurements on the same dates 5 years later. The researcher immerses a weighted disk painted black and white and measures the depth (in inches) at which it is no longer visible. The collected data is given in the table below. Complete parts (a) through (c) below. Observation 1 2 3 5 6 Date 125 3/195/307/39/13...
 all part of one question
please answer all. only answer please if our positive of the
answer
4. Alpha level and the critical region Aa Aa The alpha level that a researcher sets at the beginning of the experiment is the level to which she wishes to limit the probability of making the error of rejecting the null hypothesis when it is true rejecting the null hypothesis when it is true not rejecting the null hypothesis when it is false...
all part of one question
please answer all. only answer please if our positive of the
answer
4. Alpha level and the critical region Aa Aa The alpha level that a researcher sets at the beginning of the experiment is the level to which she wishes to limit the probability of making the error of rejecting the null hypothesis when it is true rejecting the null hypothesis when it is true not rejecting the null hypothesis when it is false...
 please help with all.
In the following probability distribution, the random variable x represents the number of activities a parent of a 6th-to 8th grade student is involved in. Complete parts (a) through (1) below. * 1 0 1 2 3 4 5 P(x) 0.269 0 206 0.224 0.239 0.062 (a) Verify that this is a discrete probability distribution This is a discrete probability distribution because the sum of the probabilities is and each probability is (6) Graph the discrete...
please help with all.
In the following probability distribution, the random variable x represents the number of activities a parent of a 6th-to 8th grade student is involved in. Complete parts (a) through (1) below. * 1 0 1 2 3 4 5 P(x) 0.269 0 206 0.224 0.239 0.062 (a) Verify that this is a discrete probability distribution This is a discrete probability distribution because the sum of the probabilities is and each probability is (6) Graph the discrete...
 Need help asap!!!
You are given the following dataset about the number of hours spent at the library on one day. 1.05 1.051.08 1.10 1.11 1.13 1.18 1.20 1.20 1.24 1.28 1.34 1.45 1.50 1.52 1.90 1.99 2.55 1.09 1.09 1.14 1.16 1.23 1.24 1.38 1.39 1.53 1.86 3.03 4.19 1. Using your dataset, make a frequency distribution table that displays intervals. Fill in the table below. Start your interval at 1.00. Use 2 decimals to help make your intervals,...
Need help asap!!!
You are given the following dataset about the number of hours spent at the library on one day. 1.05 1.051.08 1.10 1.11 1.13 1.18 1.20 1.20 1.24 1.28 1.34 1.45 1.50 1.52 1.90 1.99 2.55 1.09 1.09 1.14 1.16 1.23 1.24 1.38 1.39 1.53 1.86 3.03 4.19 1. Using your dataset, make a frequency distribution table that displays intervals. Fill in the table below. Start your interval at 1.00. Use 2 decimals to help make your intervals,...
 Can someone help with this problems please
1. (10 pts] Suppose that for a given term, data is collected on the types of courses that SPSCC students take with an interest in online and evening courses. Answer the following questions using the distribution of students below. Online Course No Online Course Totals Evening Course 28 42 70 No Evening Course 82 200 282 Totals 110 242 352 a. What is the probability a student is taking an online course? b....
Can someone help with this problems please
1. (10 pts] Suppose that for a given term, data is collected on the types of courses that SPSCC students take with an interest in online and evening courses. Answer the following questions using the distribution of students below. Online Course No Online Course Totals Evening Course 28 42 70 No Evening Course 82 200 282 Totals 110 242 352 a. What is the probability a student is taking an online course? b....
Most questions answered within 3 hours.
-
What is the yield to maturity of a ten-year, $1,000 bond with a
5.2% coupon rate...
asked 19 minutes ago -
A mass m = 5 kg is tied on one end of a rope and is...
asked 23 minutes ago -
The Average sales price of single-family houses in Charlotte is
$210,000 with a standard deviation of...
asked 32 minutes ago -
Target Costing
Laser Impressions, Inc., manufactures color laser printers.
Model J20 presently sells for $225 and...
asked 37 minutes ago -
a bottle cap manufacturer with four machines and six operators
wants to see if variation in...
asked 1 hour ago -
State Farm Insurance studies show that in Colorado, 55% of the
auto insurance claims submitted for...
asked 2 hours ago -
Complete the following reactions which form ethers (A
and B) and cyclic ethers (C-E) as major...
asked 2 hours ago -
in a perfectly elastic collision what is the velocity of ball A
if the original direction...
asked 2 hours ago -
PLEASE ANSWER ALL
1) The pressure of the atmosphere decreases with increasing
altitude in the
Choose...
asked 3 hours ago -
A simple random sample of 25,000 individuals are surveyed in
order to determine the prevalence of...
asked 3 hours ago -
People who do very detailed work close up, such as jewelers,
often can see objects clearly...
asked 3 hours ago -
14 years ago, Blue Lake Corp. issued 30 year to maturity
zero-coupon bonds with a par...
asked 3 hours ago