Part A. Score on 25 point test is normally distributed with mean 22 and standard deviation...
Part A.
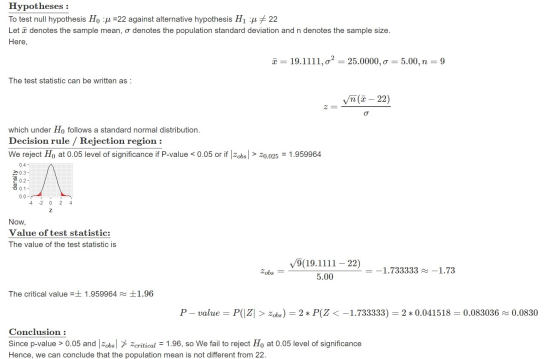
Score on 25 point test is normally distributed with mean 22 and standard deviation 5.
You took a sample of 9 students. The mean for this group is 19.111111
Test the hypothesis that the performance of this group is different than the regular group. Use α=.05.
- What is the alternative hypothesis?
- What is the rejection region?
- Calculated z
- What is your decision? Yes or no?
- You believe that the group from an honors and would perform better than the regular class. If you were to test this hypothesis, would your decision change? You are still using α=.05.
Part B.
Score on 100 points examination are is normally distributed with mean 90 and standard deviation 5. An honors class was started last year. It is believed that the average score for the honors class would be significantly higher than the score of the regular class. Test the hypothesis that the average score of the honors class is greater than the regular class. Assume that the standard deviation for the honors class is the same as that of the regular class. The average for this class of 25 students is 92. Use α=.05.
- What is the alternative hypothesis?
- Rejection region is?
- Calculated value of z is
- What is your decision? Yes or no
Part C
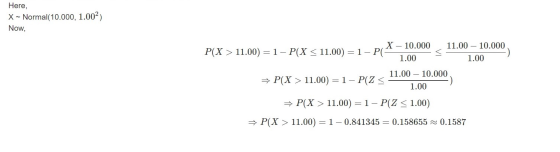
x is normally distributed with mean 10 and standard deviation 1. What is the value of the following probability:
P(x>11)?
Homework Answers
Part A)
Let  denotes the mean score for the selected group.
Part B)
Let
denotes the average score of the honors class

Part C)
Add Answer to:
Part A.
Score on 25 point test is normally distributed with mean 22 and
standard deviation...
Suppose that for some hypothesis test on the mean of a normally distributed population, standard deviation known, the P...
 Suppose that for some hypothesis test on the mean of a normally distributed population, standard deviation known, the P- value is computed as 0.11. If a level of significance of 0.05 is used, is rejecting the null hypothesis in favor of the alternative the correct decision? Yes No
The mean SAT score in mathematics, u, is 512. The standard deviation of these scores is...
 The mean SAT score in mathematics, u, is 512. The standard deviation of these scores is 25. A special preparation course claims that its graduates will score higher, on average, than the mean score 512. A random sample of 25 students completed the course, and their mean SAT score in mathematics was 520. Assume that the population is normally distributed. At the 0.1 level of significance, can we conclude that the preparation course does what it claims? Assume that the...
The mean SAT score in mathematics, μ, is 551. The standard deviation of these scores is...
 The mean SAT score in mathematics, μ, is 551. The standard deviation of these scores is 33, A special preparation course claims that its graduates will score higher, on average, than the mean score 551. A random sample of 43 students completed the course, and their mean SAT score in mathematics was 556 Assume that the population is normally distributed. At the 0.05 level of significance, can we conclude that the preparation course does what it claims? Assume that the...
the scores on a certain test are normally distributed with a mean score of 65 and...
the scores on a certain test are normally distributed with a mean score of 65 and a standard deviation of 2. what is the probability that a sample of 90 students will have a mean score of at least 65.2108.
if statistics test scores were normally distributed with a mean of 81 and a standard deviation...
if statistics test scores were normally distributed with a mean of 81 and a standard deviation of 4, a) what is the probability that a randomly selected student scored less than 70? b) what percentage of students had a B on the exam? c) the top 10% of the class had what grades?
The scores on a certain test are normally distributed with a mean score of 53 and...
 The scores on a certain test are normally distributed with a mean score of 53 and a standard deviation of 2. What is the probability that a sample of 90 students will have a mean score of at least 53.2108? 0.8413 0.3174 0.3413 0.1587
A normally distributed population has a mean of µ = 70 and a standard deviation of...
A normally distributed population has a mean of µ = 70 and a standard deviation of σ = 12. A sample (n = 36) is selected from a population and a treatment is administered to the sample. After treatment, the sample mean is found to be M = 65. Does this sample provide evidence of a statistically significant treatment effect with an alpha of 0.05 (non-directional hypothesis)? [G&W Chp 8] Yes, our z-score reaches the critical region. No, our z-score fails to...
The mean SAT score in mathematics, is 524. The standard deviation of these scores is 48....
 The mean SAT score in mathematics, is 524. The standard deviation of these scores is 48. A special preparation course daims that its graduates will score higher, on average, than the mean score 524. A random sample of 37 students completed the course, and their mean SAT score in mathematics was 534 Assume that the population is normally distributed. At the 0.05 level of significance, can we conclude that the preparation course does what it claims? Assume that the standard...
INFERENCES ABOUT THE POPULATION MEAN DISTINGUISH BETWEEN Z-TEST AND T-TEST. 1. A GROUP OF 9 STORE...
INFERENCES ABOUT THE POPULATION MEAN DISTINGUISH BETWEEN Z-TEST AND T-TEST. 1. A GROUP OF 9 STORE MANAGERS WAS DRAWN FOR ANALYSIS OF THEIR IQ SCORES. ASSUME THAT INDIVIDUAL SCORES ARE NORMALLY DISTRIBUTED, WITH THE UNKNOWN POPULATION AVERAGE AND POPULATION STANDARD DEVIATION OF 15. SAMPLE SUMMARIES WERE: (SAMPLE MEAN) = 88.2 AND (SAMPLE STANDARD DEVIATION) = 12. (A) AT THE 1% SIGNIFICANCE LEVEL, DO WE HAVE SUFFICIENT EVIDENCE THAT THE POPULATION AVERAGE IQ WAS BELOW 100? CIRCLE ONE: YES! || NO!...
Suppose scores of students on a test are approximately normally distributed with a mean score of...
Suppose scores of students on a test are approximately normally distributed with a mean score of 65 points and a standard deviation of 8 points. It is decided to give A's to 10 percent of the students. Obtain the threshold score that will result in an A.
 Suppose that for some hypothesis test on the mean of a normally distributed population, standard deviation known, the P- value is computed as 0.11. If a level of significance of 0.05 is used, is rejecting the null hypothesis in favor of the alternative the correct decision? Yes No
 The mean SAT score in mathematics, u, is 512. The standard deviation of these scores is 25. A special preparation course claims that its graduates will score higher, on average, than the mean score 512. A random sample of 25 students completed the course, and their mean SAT score in mathematics was 520. Assume that the population is normally distributed. At the 0.1 level of significance, can we conclude that the preparation course does what it claims? Assume that the...
 The mean SAT score in mathematics, μ, is 551. The standard deviation of these scores is 33, A special preparation course claims that its graduates will score higher, on average, than the mean score 551. A random sample of 43 students completed the course, and their mean SAT score in mathematics was 556 Assume that the population is normally distributed. At the 0.05 level of significance, can we conclude that the preparation course does what it claims? Assume that the...
 The scores on a certain test are normally distributed with a mean score of 53 and a standard deviation of 2. What is the probability that a sample of 90 students will have a mean score of at least 53.2108? 0.8413 0.3174 0.3413 0.1587
 The mean SAT score in mathematics, is 524. The standard deviation of these scores is 48. A special preparation course daims that its graduates will score higher, on average, than the mean score 524. A random sample of 37 students completed the course, and their mean SAT score in mathematics was 534 Assume that the population is normally distributed. At the 0.05 level of significance, can we conclude that the preparation course does what it claims? Assume that the standard...
Most questions answered within 3 hours.
-
Calculate the approximate number of residues of Rubisco, which
is involved in carbon fixation in plants,...
asked 13 minutes ago -
Other decisions about scientific claims can have a much broader
impact.ENERGYarrow-10x10.png, environment, health, security - all...
asked 1 hour ago -
I need to write a research paper and work cited about this
topic: The United States...
asked 1 hour ago -
Hello! I was wondering if I could have some help?
If the vapor pressure of carvone...
asked 1 hour ago -
An economist wants to estimate the mean per capita income (in
thousands of dollars) for a...
asked 2 hours ago -
What would be the input/output characteristic of a circuit
obtained by putting two of your 2's-complementers...
asked 2 hours ago -
In Drosophila, the transition from the syncytial blastoderm
stage to the cellular blastoderm stage is a...
asked 2 hours ago -
Project management question:
Name 3 different types of resources (hint: humans are one
type)
asked 2 hours ago -
Consider the following reaction: C 2H 2( g) + 2H 2( g) C 2H 6(
g)...
asked 2 hours ago -
Consider a 1.0 L buffer containing 0.092 mol L-1 HCOOH and 0.100
mol L-1 HCOO-. What...
asked 3 hours ago -
Koch Realty has owned a vacant land with a FMV of
$775,000 and an adjusted basis...
asked 3 hours ago -
It is estimated 29% of all adults in United States invest in
stocks and that 85%...
asked 3 hours ago