
Homework Answers


Add Answer to:
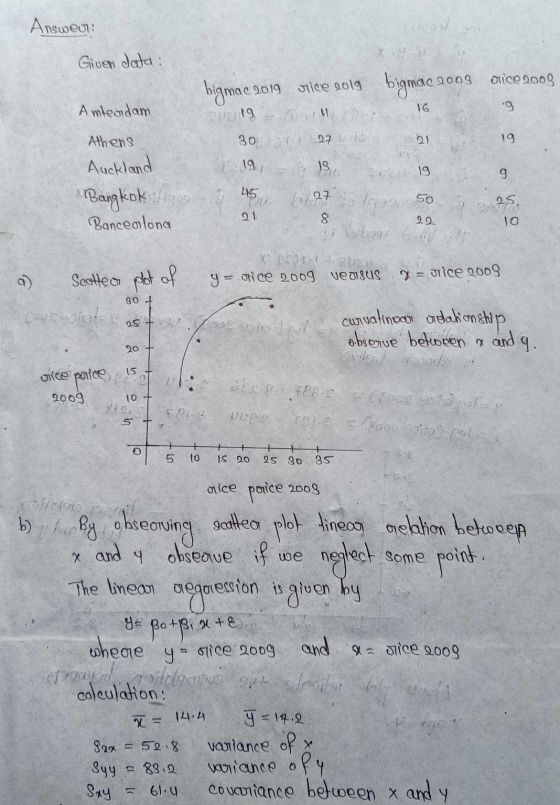
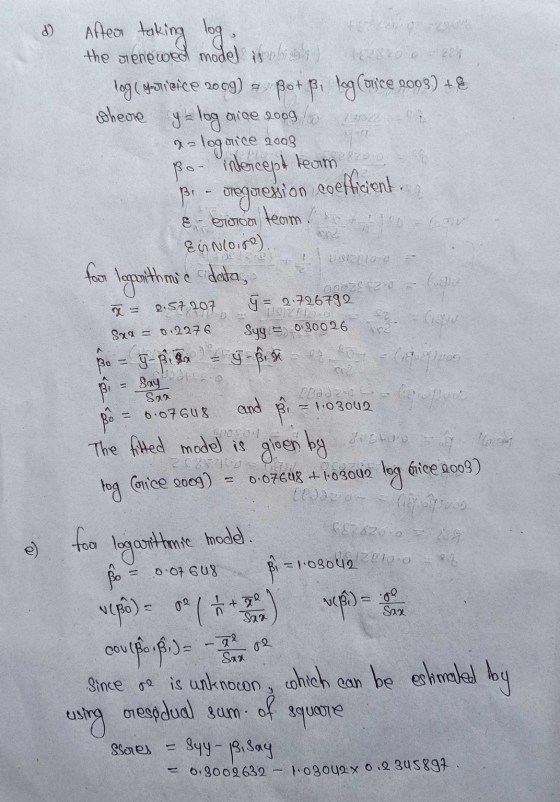
1,2)- The international bank UBS regularly produces a report (UBS, 2009) on prices and earnings in...
A financial analyst is examining the relationship between stock prices and earnings per share. She chooses...
 A financial analyst is examining the relationship between stock prices and earnings per share. She chooses fifteen, publicly traded companies at random and records for each the company's current stock price and the company's earnings per share reported for the past 12 months. Her data are given below, with X denoting the earnings per share from the previous year and y denoting the current stock price (both in dollars). A scatter plot of her data is shown in Figure 1....
3. (40 points) Use the graph, an output of the least squares prediction equation for the starting salary data (in thous...
 3. (40 points) Use the graph, an output of the least squares prediction equation for the starting salary data (in thousands of dollars) given a graduated student's cumulative GPA, and the table of sampled data below to do the following Student ID GPA(x) 3.26 Starting Salary (y) 33.8 2.60 29.8 3.35 33.5 2.86 30.4 3.82 36.4 2.21 27.6 3.47 35.3 Regression Plot Y= 14.8156 + 5.70657x R-Sq 0.977 寸 853 4.0 2.0 2.5 3.0 3.5 GPA (a) Identify and interpret...
Case: A small convenience store chain is interested in modeling the weekly sales of a store,...
Case: A small convenience store chain is interested in modeling the weekly sales of a store, y, as a function of the weekly traffic flow on the street where the store is located. The table below contains data collected from 24 stores in the chain. Store Weekly Traffic Flow (thousands of cars) Weekly Sales ($ thousands) 1 59.3 6.3 2 60.3 6.6 3 82.1 7.6 4 32.3 3.0 5 98 9.5 6 54.1 5.9 7 54.4 6.1 8 51.3 5.0...
Question 3 is the same as 10.19 below, they are just for reference. Please do question...
 Question 3 is the same as 10.19 below, they are just for reference.
Please do question 4.
please use R to do this question, provide R codes.
Questlon 3 (6 polnts total) The Storm Prediction Center of the National Ocesnic and Atmospheric Administration maintains a database of tornadoes, floods, and other weather phenomena. The fle "EX10-19TWISTER.CaV Includes the anmual mumber of tornadoes in the Untted States between 1953 and 2014. Use R to carry out the analysts and answer the...
Question 3 is the same as 10.19 below, they are just for reference.
Please do question 4.
please use R to do this question, provide R codes.
Questlon 3 (6 polnts total) The Storm Prediction Center of the National Ocesnic and Atmospheric Administration maintains a database of tornadoes, floods, and other weather phenomena. The fle "EX10-19TWISTER.CaV Includes the anmual mumber of tornadoes in the Untted States between 1953 and 2014. Use R to carry out the analysts and answer the...
In cell C6, insert a Scatter Chart for the Returns Completed versus Return Price data from...
 In
cell C6, insert a Scatter Chart for the Returns
Completed versus Return Price data from the Data
worksheet. You may be used to seeing Price placed on the Y-axis
from other economics courses, but in this problem we are using
price as the independent variable.
Inserting Chart
Select the Scatter chart from the provided chart options in the
Charts group of the Insert tab of the Ribbon.
Selecting Data Series
Then choose Select Data in the Design tab on...
In
cell C6, insert a Scatter Chart for the Returns
Completed versus Return Price data from the Data
worksheet. You may be used to seeing Price placed on the Y-axis
from other economics courses, but in this problem we are using
price as the independent variable.
Inserting Chart
Select the Scatter chart from the provided chart options in the
Charts group of the Insert tab of the Ribbon.
Selecting Data Series
Then choose Select Data in the Design tab on...
Please answer the whole question, I need them all I will give thumbs up This is...
 Please answer the whole question, I need them all
I will give thumbs up
This is should be the
TAMPALMS.txt (1.292 KB)
Property Market_Val Sale_Price
1 181.44 382.0
2 191.00 230.0
3 159.83 220.0
4 189.22 277.0
5 151.61 205.0
6 166.40 250.0
7 157.09 235.0
8 211.74 284.0
9 146.45 247.7
10 131.80 159.0
11 131.05 200.0
12 191.98 285.0
13 138.85 170.0
14 147.95 215.0
15 121.98 149.0
16 113.08 165.0
17 138.02 205.0
18 162.65 262.5
19 ...
Please answer the whole question, I need them all
I will give thumbs up
This is should be the
TAMPALMS.txt (1.292 KB)
Property Market_Val Sale_Price
1 181.44 382.0
2 191.00 230.0
3 159.83 220.0
4 189.22 277.0
5 151.61 205.0
6 166.40 250.0
7 157.09 235.0
8 211.74 284.0
9 146.45 247.7
10 131.80 159.0
11 131.05 200.0
12 191.98 285.0
13 138.85 170.0
14 147.95 215.0
15 121.98 149.0
16 113.08 165.0
17 138.02 205.0
18 162.65 262.5
19 ...
 A financial analyst is examining the relationship between stock prices and earnings per share. She chooses fifteen, publicly traded companies at random and records for each the company's current stock price and the company's earnings per share reported for the past 12 months. Her data are given below, with X denoting the earnings per share from the previous year and y denoting the current stock price (both in dollars). A scatter plot of her data is shown in Figure 1....
 3. (40 points) Use the graph, an output of the least squares prediction equation for the starting salary data (in thousands of dollars) given a graduated student's cumulative GPA, and the table of sampled data below to do the following Student ID GPA(x) 3.26 Starting Salary (y) 33.8 2.60 29.8 3.35 33.5 2.86 30.4 3.82 36.4 2.21 27.6 3.47 35.3 Regression Plot Y= 14.8156 + 5.70657x R-Sq 0.977 寸 853 4.0 2.0 2.5 3.0 3.5 GPA (a) Identify and interpret...
 Question 3 is the same as 10.19 below, they are just for reference.
Please do question 4.
please use R to do this question, provide R codes.
Questlon 3 (6 polnts total) The Storm Prediction Center of the National Ocesnic and Atmospheric Administration maintains a database of tornadoes, floods, and other weather phenomena. The fle "EX10-19TWISTER.CaV Includes the anmual mumber of tornadoes in the Untted States between 1953 and 2014. Use R to carry out the analysts and answer the...
Question 3 is the same as 10.19 below, they are just for reference.
Please do question 4.
please use R to do this question, provide R codes.
Questlon 3 (6 polnts total) The Storm Prediction Center of the National Ocesnic and Atmospheric Administration maintains a database of tornadoes, floods, and other weather phenomena. The fle "EX10-19TWISTER.CaV Includes the anmual mumber of tornadoes in the Untted States between 1953 and 2014. Use R to carry out the analysts and answer the...
 In
cell C6, insert a Scatter Chart for the Returns
Completed versus Return Price data from the Data
worksheet. You may be used to seeing Price placed on the Y-axis
from other economics courses, but in this problem we are using
price as the independent variable.
Inserting Chart
Select the Scatter chart from the provided chart options in the
Charts group of the Insert tab of the Ribbon.
Selecting Data Series
Then choose Select Data in the Design tab on...
In
cell C6, insert a Scatter Chart for the Returns
Completed versus Return Price data from the Data
worksheet. You may be used to seeing Price placed on the Y-axis
from other economics courses, but in this problem we are using
price as the independent variable.
Inserting Chart
Select the Scatter chart from the provided chart options in the
Charts group of the Insert tab of the Ribbon.
Selecting Data Series
Then choose Select Data in the Design tab on...
 Please answer the whole question, I need them all
I will give thumbs up
This is should be the
TAMPALMS.txt (1.292 KB)
Property Market_Val Sale_Price
1 181.44 382.0
2 191.00 230.0
3 159.83 220.0
4 189.22 277.0
5 151.61 205.0
6 166.40 250.0
7 157.09 235.0
8 211.74 284.0
9 146.45 247.7
10 131.80 159.0
11 131.05 200.0
12 191.98 285.0
13 138.85 170.0
14 147.95 215.0
15 121.98 149.0
16 113.08 165.0
17 138.02 205.0
18 162.65 262.5
19 ...
Please answer the whole question, I need them all
I will give thumbs up
This is should be the
TAMPALMS.txt (1.292 KB)
Property Market_Val Sale_Price
1 181.44 382.0
2 191.00 230.0
3 159.83 220.0
4 189.22 277.0
5 151.61 205.0
6 166.40 250.0
7 157.09 235.0
8 211.74 284.0
9 146.45 247.7
10 131.80 159.0
11 131.05 200.0
12 191.98 285.0
13 138.85 170.0
14 147.95 215.0
15 121.98 149.0
16 113.08 165.0
17 138.02 205.0
18 162.65 262.5
19 ...
Most questions answered within 3 hours.
-
Given input { 66, 28, 43, 29, 44, 69, 19 } and a hash function
h(x)...
asked 5 minutes ago -
A pebble with mass m is thrown straight up with an initial speed
v0 so that...
asked 8 minutes ago -
Let X be a discrete random variable that follows a
binomial distribution with n = 11...
asked 17 minutes ago -
The equilibrium constant, K, for the following reaction is
1.29×10⁻² at 600
K.
COCl2(g) --->
CO(g)...
asked 30 minutes ago -
It is known that 72% of people have a favorable opinion of their
local police force....
asked 33 minutes ago -
A vertical straight wire carrying an upward 26-A current exerts
an attractive force per unit length...
asked 46 minutes ago -
For the purposes of this assignment, you are to choose an
adaptive trait common to more...
asked 54 minutes ago -
Two identical flutes can play middle C (262 Hz) at 20◦C. How
many beats per second...
asked 1 hour ago -
Potassium phosphate and calcium chloride react in a double
replacement reaction. To produce 1.0 moles of...
asked 57 minutes ago -
Sparky, Co. purchased land as a factory site for $600,000.
Sparky paid $42,000 to tear down...
asked 1 hour ago -
A Chi-square distribution with 14 degrees of freedom is a
correct model for
Question 8 options:...
asked 1 hour ago -
In a group of 45 mice, there are 10 that have a certain genetic
character. suppose...
asked 1 hour ago