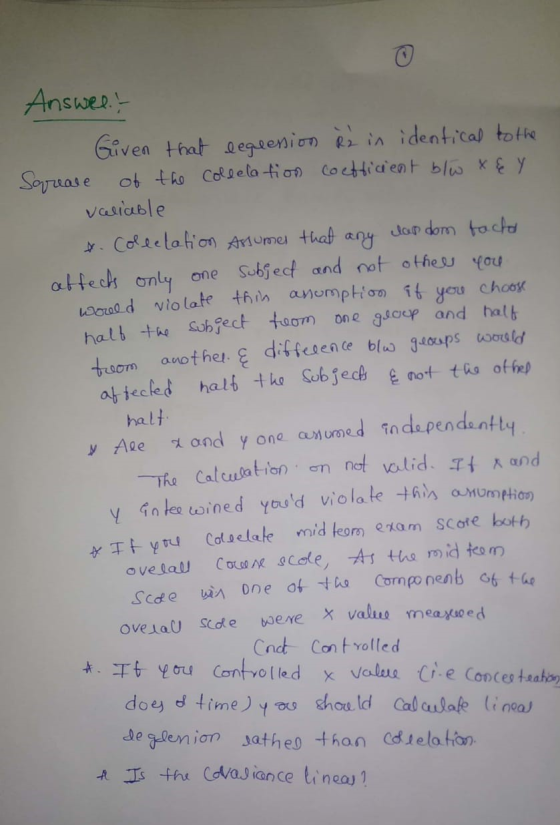
Prove that the regression R2 is identical to the square of the correlation coefficient between two...
Prove that the regression R2 is identical to the square of the correlation coefficient between two variables Y and X. Regression functions are written in a form that suggests causation running from X to Y. Given your proof, does a high regression R2 present supportive evidence of a causal relationship? Can you think of some regression examples where the direction of causality is not clear? Is without a doubt
Homework Answers


Add Answer to:
Prove that the regression R2 is identical to the square of the
correlation coefficient between two...
A regression was run to determine if there is a relationship between hours of TV watched...
A regression was run to determine if there is a relationship between hours of TV watched per day (x) and the number of sit-ups a person can do (y). The results were: y = a+bx b = -0.79 a = 23.59 r2 = 0.6551 If a person watches 16 hours of television a day, predict how many sit-ups he can do. 10.95 Correct What is the value of the correlation coefficient? Round to three decimal places. .809 - I need...
Drop down options are durability, impact properties, shock absorbing capabilities, the two independent variables. A regression...
 Drop down options are durability, impact properties, shock
absorbing capabilities, the two independent variables.
A regression analysis is performed to predict the durability of a brand of running shoe, based on the shock-absorbing capability and the change in impact properties over time. The resulting ANOVA table is below. Complete parts (a) through (d). Degrees of Sum of Freedom Squares Regression Error Total 10.45577 6.46314 16.91891 Mean Square 5.22789 0.28101 p-value 0.00002 18.60 2 23 25 a. Determine whether there is...
Drop down options are durability, impact properties, shock
absorbing capabilities, the two independent variables.
A regression analysis is performed to predict the durability of a brand of running shoe, based on the shock-absorbing capability and the change in impact properties over time. The resulting ANOVA table is below. Complete parts (a) through (d). Degrees of Sum of Freedom Squares Regression Error Total 10.45577 6.46314 16.91891 Mean Square 5.22789 0.28101 p-value 0.00002 18.60 2 23 25 a. Determine whether there is...
The (population) correlation coefficient, called p, is discussed in Section 4.5.2 of your text. Given two...
 The (population) correlation coefficient, called p, is discussed in Section 4.5.2 of your text. Given two random variables X and Y with some joint distribution and means ux and uy, p= Corr(X,Y) = Cov(X, Y), where σχσY oſ = Var(x), of = Var(y) and Cov(X,Y) = E[(X - MX)(Y – My)] Given data, we can estimate p. Suppose that (X1,Y1), ..., (Xn, Yn) are independent and iden- tically distributed (i.i.d.) pairs of realizations of the random variables (X, Y). How...
Regression and Correlation Methods: Correlation, ANOVA, and Least Squares This is another way of assessing the...
Regression and Correlation Methods: Correlation, ANOVA, and Least Squares This is another way of assessing the possible association between a normally distributed variable y and a categorical variable x. These techniques are special cases of linear regression methods. The purpose of the assignment is to demonstrate methods of regression and correlation analysis in which two different variables in the same sample are related. The following are three important statistics, or methodologies, for using correlation and regression: Pearson's correlation coefficient ANOVA...
Question 1 1 pts The equation of the regression line between two variables x (independent variable)...
 Question 1 1 pts The equation of the regression line between two variables x (independent variable) and y (dependent variable) is given by ý = -3x -- 2; and the correlation coefficient iss =-.95. The possible x- values range from 1 to 10. Based on the given r, which of the following conclusions may be made? X and Y are very weakly correlated. and y are moderately correlated, and y tends to increase as x is increased. X and y...
Assume for a moment that these 20 houses made up the entire population of houses in San Antonio. Use the Data Analysis...
 Assume for a moment that these 20 houses made up the entire population of houses in San Antonio. Use the Data Analysis Sampling function to choose a random sample of 7 house prices from the population. Put a label called "Sample of 7" over the list you create. 4. 3. Highlight all the data, including both Square Footage and Price, and use the Insert Scatter function to create a Scatter Diagram. Change the title and add a linear trend line...
this is concept. 2. A plant distills liquid air to produce oxygen, nitrogen, and argon. The...
 this is concept.
2. A plant distills liquid air to produce oxygen, nitrogen, and argon. The percentage of impurity in the oxygen is thought to be linearly related to the amount of impurities in the air as measured by the pollution count" in part per million (ppm). A sample of plant operating data is shown below. Pollution count (ppm) Purity (%) 933 1145 1.59 92.4 91.7 94 1.08 Purity (%) 946 12 93.6 0.99 0.83 12 932 1.47 1.81 05...
this is concept.
2. A plant distills liquid air to produce oxygen, nitrogen, and argon. The percentage of impurity in the oxygen is thought to be linearly related to the amount of impurities in the air as measured by the pollution count" in part per million (ppm). A sample of plant operating data is shown below. Pollution count (ppm) Purity (%) 933 1145 1.59 92.4 91.7 94 1.08 Purity (%) 946 12 93.6 0.99 0.83 12 932 1.47 1.81 05...
The reasons given by workers for quitting their jobs generally fall into one of two categories:...
The reasons given by workers for quitting their jobs generally fall into one of two categories: (1) Worker quits to seek or take a different job, or (2) worker quits to withdraw from the labor force. Economic theory suggests that wages and quit rates are related. The table below lists quit rates (quits per 100 employees) and the average hourly wage in a sample of 15 manufacturing industries. Industry Quit Rate, y Average Wage, x ($) 1 1.4 8.20 2...
The reasons given by workers for quitting their jobs generally fall into one of two categories:...
The reasons given by workers for quitting their jobs generally fall into one of two categories: (1) Worker quits to seek or take a different job, or (2) worker quits to withdraw from the labor force. Economic theory suggests that wages and quit rates are related. The table below lists quit rates (quits per 100 employees) and the average hourly wage in a sample of 15 manufacturing industries. Industry Quit Rate,y Average Wage, x($) 1 1.3 8.45 2 0.6 10.6...
The user (me) will input between 3 and 20 data points for two variables on Sheet1...
The user (me) will input between 3 and 20 data points for two variables on Sheet1 starting in cells A2 and B2 (your program should work if I input 3, 4, 5, … , or 20 data points). Column A will contain the values for variable x and column B will contain the values for variable y. Graphical User Interface Create a UserForm on Sheet1 that contains the following controls: A Run button will be used to execute a macro...
 Drop down options are durability, impact properties, shock
absorbing capabilities, the two independent variables.
A regression analysis is performed to predict the durability of a brand of running shoe, based on the shock-absorbing capability and the change in impact properties over time. The resulting ANOVA table is below. Complete parts (a) through (d). Degrees of Sum of Freedom Squares Regression Error Total 10.45577 6.46314 16.91891 Mean Square 5.22789 0.28101 p-value 0.00002 18.60 2 23 25 a. Determine whether there is...
Drop down options are durability, impact properties, shock
absorbing capabilities, the two independent variables.
A regression analysis is performed to predict the durability of a brand of running shoe, based on the shock-absorbing capability and the change in impact properties over time. The resulting ANOVA table is below. Complete parts (a) through (d). Degrees of Sum of Freedom Squares Regression Error Total 10.45577 6.46314 16.91891 Mean Square 5.22789 0.28101 p-value 0.00002 18.60 2 23 25 a. Determine whether there is...
 The (population) correlation coefficient, called p, is discussed in Section 4.5.2 of your text. Given two random variables X and Y with some joint distribution and means ux and uy, p= Corr(X,Y) = Cov(X, Y), where σχσY oſ = Var(x), of = Var(y) and Cov(X,Y) = E[(X - MX)(Y – My)] Given data, we can estimate p. Suppose that (X1,Y1), ..., (Xn, Yn) are independent and iden- tically distributed (i.i.d.) pairs of realizations of the random variables (X, Y). How...
 Question 1 1 pts The equation of the regression line between two variables x (independent variable) and y (dependent variable) is given by ý = -3x -- 2; and the correlation coefficient iss =-.95. The possible x- values range from 1 to 10. Based on the given r, which of the following conclusions may be made? X and Y are very weakly correlated. and y are moderately correlated, and y tends to increase as x is increased. X and y...
 Assume for a moment that these 20 houses made up the entire population of houses in San Antonio. Use the Data Analysis Sampling function to choose a random sample of 7 house prices from the population. Put a label called "Sample of 7" over the list you create. 4. 3. Highlight all the data, including both Square Footage and Price, and use the Insert Scatter function to create a Scatter Diagram. Change the title and add a linear trend line...
 this is concept.
2. A plant distills liquid air to produce oxygen, nitrogen, and argon. The percentage of impurity in the oxygen is thought to be linearly related to the amount of impurities in the air as measured by the pollution count" in part per million (ppm). A sample of plant operating data is shown below. Pollution count (ppm) Purity (%) 933 1145 1.59 92.4 91.7 94 1.08 Purity (%) 946 12 93.6 0.99 0.83 12 932 1.47 1.81 05...
this is concept.
2. A plant distills liquid air to produce oxygen, nitrogen, and argon. The percentage of impurity in the oxygen is thought to be linearly related to the amount of impurities in the air as measured by the pollution count" in part per million (ppm). A sample of plant operating data is shown below. Pollution count (ppm) Purity (%) 933 1145 1.59 92.4 91.7 94 1.08 Purity (%) 946 12 93.6 0.99 0.83 12 932 1.47 1.81 05...
Most questions answered within 3 hours.
-
Which of the following statements are true?
1. Glass is mostly silicon dioxide and so when...
asked 17 minutes ago -
Korman Company has the following securities in its portfolio of
equity securities on December 31, 2018:...
asked 17 minutes ago -
Using the 12th edition of Language Awareness,
complete the following assignment:
After reading Akiba Solomon's "Thugs....
asked 28 minutes ago -
For all problems assume an effective monthly interest rate of 1%
unless otherwise indicated in the...
asked 39 minutes ago -
Fix all syntax and logical errors for the following program.
Please generate the correct output. //...
asked 47 minutes ago -
The USPS sells money orders identified by an 11 –digit number
x1, x2, …, x11. The...
asked 51 minutes ago -
Provide an example of equilibrium in relation to
Newton’s First and Second Laws. Explain your answer....
asked 52 minutes ago -
You are __________ to commit a Type I error using the 0.05 level
of significance than...
asked 1 hour ago -
1. the following results are obtained:
200
kiwi
575 wild-type
What can we conclude about the...
asked 1 hour ago -
Explain how you might use E. coli bacteria to produce human
growth hormone using the following:...
asked 1 hour ago -
WHAT IS THE EFFEKT OF ADD K2CO3 TO ( METHANOL OG WATER)?
asked 1 hour ago -
Calculate the cell potential, the equilibrium constant, and the
free-energy change for: Ca(s)+Mn2+(aq)(1M)⇌Ca2+(aq)(1M)+Mn(s) given
the following...
asked 1 hour ago