5) The overall percentages-of-total-possible-credit in a particular statistics class were recorded for 20 students along with...
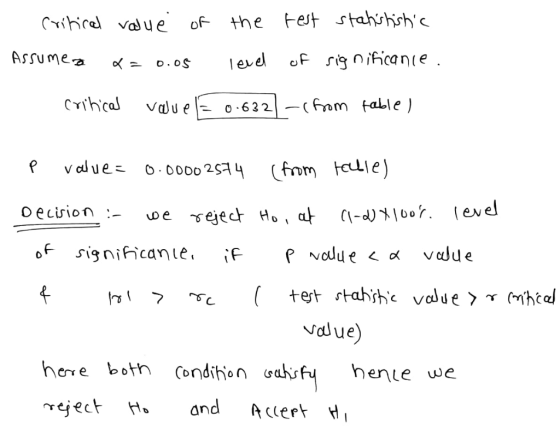
5) The overall percentages-of-total-possible-credit in a particular statistics class were recorded for 20 students along with the students’ age in months. The rankings of the data are given below. Test the following H0: Age is unrelated to performance in this class? Use rank correlation.
| Student j | Age | % |
| 1 | 1 | 1 |
| 2 | 2 | 2 |
| 3 | 4 | 3 |
| 4 | 3 | 4 |
| 5 | 5 | 7 |
| 6 | 6 | 5 |
| 7 | 7 | 6 |
| 8 | 8 | 8 |
| 9 | 9 | 9 |
| 10 | 10 | 10 |
Calculated test statistic:
Critical value of the test statistic:
Decision rule: Decision:
Homework Answers


Add Answer to:
5) The overall percentages-of-total-possible-credit in a
particular statistics class were recorded for 20 students along
with...
) A sample of 15 graduating students, 15 females and 5 males, was randomly selected. Their GPAs were recorded, and the ranks of these GPAs for the pooled sample are presented below. Test the following...
) A sample of 15 graduating students, 15 females and 5 males, was randomly selected. Their GPAs were recorded, and the ranks of these GPAs for the pooled sample are presented below. Test the following hypothesis: H0: There is no difference in GPAs between the genders? Use the Mann-Whitney test. Males Females 11 1 12 2 3 13 14 4 6 5 15 7 8 9 10 Calculated test statistic: Critical value of the test statistic: Decision rule: Decision:
Randomly selected students in a statistics class were asked to report the number of hours they...
Randomly selected students in a statistics class were asked to report the number of hours they slept on weeknights and on weekends. At α = 0.05, the experimenter wants to know if there is sufficient evidence that there is a difference in the mean number of hours slept. Student 1 2 3 4 5 6 7 8 Hours Sun-Thurs 8 5.5 7.5 8 7 6 6 8 Hours Fri-Sat 4 7 10.5 12 11 9 6 9 a. State the hypotheses and identify the claim. b. A student calculates the test statistic using this formula: Is this the correct formula to use for this situation? (Hint:...
Suppose a teacher recorded the attendance of her students in a recent statistics class because she...
 Suppose a teacher recorded the attendance of her students in a
recent statistics class because she wanted to investigate the
linear relationship between the number of classes they missed and
their final grades. The accompanying table shows these data for a
random sample of nine students
Classes Missed Final Grade
4 73
6 81
1 92
4 72
0 94
2 86
0 89
5 87
2 96
Suppose a teacher recorded the attendance of her students in a recent...
Suppose a teacher recorded the attendance of her students in a
recent statistics class because she wanted to investigate the
linear relationship between the number of classes they missed and
their final grades. The accompanying table shows these data for a
random sample of nine students
Classes Missed Final Grade
4 73
6 81
1 92
4 72
0 94
2 86
0 89
5 87
2 96
Suppose a teacher recorded the attendance of her students in a recent...
7. A group of husbands and wives were asked to rank the taste of 10 Lean...
 7. A group of husbands and wives were asked to rank the taste of 10 Lean Cuisine meals. Their rankings are as follows: 9 3 S 4 9 2. 10 9 7 Meal 1 Hus. 1 Wife 2 8 دره 2 10 6 7 5 4 10 1 5 6 At the a - .05 level, are the rankings of husbands and wives linearly related? SIGN TEST FOR MATCHED DATA Problem # Number of tails: Critical Value: Test Value: Decision...
Ten new sales representatives for Clark Sprocket and Chain, Inc. were required to attend a training...
Ten new sales representatives for Clark Sprocket and Chain, Inc. were required to attend a training program before being assigned to a regional sales office. At the end of the program, the representatives took a series of tests and the scores were ranked. For example, Arden had the lowest test score and is ranked 1; Arbuckle had the highest test score and is ranked 10. At the end of the first sales year, the representatives’ ranks based on test scores...
Suppose a teacher recorded the attendance of her students in a recent statistics class because she...
 Suppose a teacher recorded the attendance of her students in a recent statistics class because she wanted to investigate the linear relationship between the number of classes they missed and their final grades. The accompanying table shows these data for a random sample of nine students. Complete parts a through c. Click the icon to view the table showing missed classes and final grade. a. Calculate the correlation coefficient for this sample. The correlation coefficient is I. (Type an integer...
We predict that learning statistics will increase a student's IQ. Those not learning statistics have a...
We predict that learning statistics will increase a student's IQ. Those not learning statistics have a population mean of 100 with a standard deviation of 15. For 25 statistics students, the mean is equal to 108.6. Use a Z test and the 10 step processto determine if learning statistics increases a student's IQ. Step 1: Research Hypothesis? Step 2: Null Hypothesis? Step 3: One or two tails? Step 4: Alpha level? Step 5: What test? Step 6: Degrees of Freedom?N/A...
Two placement exams are available that students can take to determine which math class they should...
 Two placement exams are
available that students can take to determine which math class they
should begin with in their freshman year. It is believed that there
is no difference in the mean scores that would be received for the
two tests. To test this using a 0.05 level of significance, a
randomly selected group of students took both tests and had their
scores recorded. The following data were obtained: Student Test A
Test B 1 78 82 2 86...
Two placement exams are
available that students can take to determine which math class they
should begin with in their freshman year. It is believed that there
is no difference in the mean scores that would be received for the
two tests. To test this using a 0.05 level of significance, a
randomly selected group of students took both tests and had their
scores recorded. The following data were obtained: Student Test A
Test B 1 78 82 2 86...
Two placement exams are available that students can take to determine which math class they should...
 Two placement exams are available that students can take to determine which math class they should begin with in their freshman ye. It is believed that there is no difference in the mean scores that would be received for the two tests. To test this using a 0.05 level of significance, a randomly selected group of students took both tests and had their scores recorded the following data were obtained Student Test A Test B 1 78 2 74 3...
5 7 8 10 11 12 Suppose a teacher recorded the attendance of her students in...
 5 7 8 10 11 12 Suppose a teacher recorded the attendance of her students in a recent statistics class because she wanted to investigate the linear relationship between the number of classes they missed and their final grades. The accompanying table shows these data for a random sample of nine students. Complete parts a through c. Click the icon to view the table showing missed classes and final grade. a. Calculate the correlation coefficient for this sample. The correlation...
 Suppose a teacher recorded the attendance of her students in a
recent statistics class because she wanted to investigate the
linear relationship between the number of classes they missed and
their final grades. The accompanying table shows these data for a
random sample of nine students
Classes Missed Final Grade
4 73
6 81
1 92
4 72
0 94
2 86
0 89
5 87
2 96
Suppose a teacher recorded the attendance of her students in a recent...
Suppose a teacher recorded the attendance of her students in a
recent statistics class because she wanted to investigate the
linear relationship between the number of classes they missed and
their final grades. The accompanying table shows these data for a
random sample of nine students
Classes Missed Final Grade
4 73
6 81
1 92
4 72
0 94
2 86
0 89
5 87
2 96
Suppose a teacher recorded the attendance of her students in a recent...
 7. A group of husbands and wives were asked to rank the taste of 10 Lean Cuisine meals. Their rankings are as follows: 9 3 S 4 9 2. 10 9 7 Meal 1 Hus. 1 Wife 2 8 دره 2 10 6 7 5 4 10 1 5 6 At the a - .05 level, are the rankings of husbands and wives linearly related? SIGN TEST FOR MATCHED DATA Problem # Number of tails: Critical Value: Test Value: Decision...
 Suppose a teacher recorded the attendance of her students in a recent statistics class because she wanted to investigate the linear relationship between the number of classes they missed and their final grades. The accompanying table shows these data for a random sample of nine students. Complete parts a through c. Click the icon to view the table showing missed classes and final grade. a. Calculate the correlation coefficient for this sample. The correlation coefficient is I. (Type an integer...
 Two placement exams are
available that students can take to determine which math class they
should begin with in their freshman year. It is believed that there
is no difference in the mean scores that would be received for the
two tests. To test this using a 0.05 level of significance, a
randomly selected group of students took both tests and had their
scores recorded. The following data were obtained: Student Test A
Test B 1 78 82 2 86...
Two placement exams are
available that students can take to determine which math class they
should begin with in their freshman year. It is believed that there
is no difference in the mean scores that would be received for the
two tests. To test this using a 0.05 level of significance, a
randomly selected group of students took both tests and had their
scores recorded. The following data were obtained: Student Test A
Test B 1 78 82 2 86...
 Two placement exams are available that students can take to determine which math class they should begin with in their freshman ye. It is believed that there is no difference in the mean scores that would be received for the two tests. To test this using a 0.05 level of significance, a randomly selected group of students took both tests and had their scores recorded the following data were obtained Student Test A Test B 1 78 2 74 3...
 5 7 8 10 11 12 Suppose a teacher recorded the attendance of her students in a recent statistics class because she wanted to investigate the linear relationship between the number of classes they missed and their final grades. The accompanying table shows these data for a random sample of nine students. Complete parts a through c. Click the icon to view the table showing missed classes and final grade. a. Calculate the correlation coefficient for this sample. The correlation...
Most questions answered within 3 hours.
-
You have a yeast cell culture with a concentration of 5x10^4
cells/ml. If you dilute this...
asked 1 minute ago -
In which direction the Reaction goes? Show detailed process.
SeO3 + 2ClO2. + 2H3O <---> Se...
asked 14 minutes ago -
Unexposed silver halides are removed from photographic film when
they react with sodium thiosulfate
(Na2S2O3, called...
asked 15 minutes ago -
A 0.3054 gram sample of the mineral chalcopyrite (CuFeS2)
yielded 0.6525 gram BaSO4 precipitate. What is...
asked 15 minutes ago -
An short-seller in Tesla is worried the latest management
earnings forecast is too aggressive and the...
asked 1 hour ago -
Question 3 (1 point)
Fill in the blank. Speed Car Rental company found that the tire...
asked 1 hour ago -
1. A copper wire is 26.61 cm long and weighs 1.265 g. The
density of copper...
asked 39 minutes ago -
Remember that a concept sketch consists of a sketch (or
series of sketches), labels, and complete...
asked 41 minutes ago -
on a newly discovered planet, the period of a pendulum with a
length of 2 m...
asked 43 minutes ago -
Why [M(CN)6] is not organometallic even it has metal
to carbon bond too
asked 50 minutes ago -
mstar electric has a bond issue outstanding that has a 20 year
life, a $1,000 par...
asked 57 minutes ago -
This is a Business Writing Question:
Common Types of Faulty Sentence Logic:
A. Mixed constructions
B....
asked 58 minutes ago