Apply the t −test to the following sample and test the hypotheses. 11 12 13 10...
Apply the t −test to the following sample and test the hypotheses.
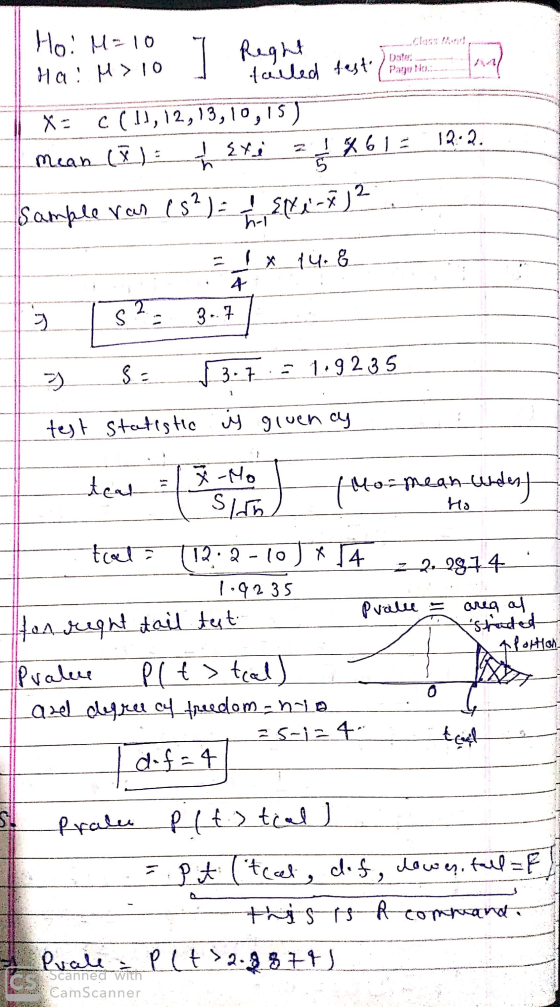
| 11 |
| 12 |
| 13 |
| 10 |
| 15 |
H 0 : μ = 10
H a : μ > 10.
Homework Answers

Add Answer to:
Apply the t −test to the following sample and test the
hypotheses.
11
12
13
10...
Use the t-distribution and the sample results to complete the test of the hypotheses. Use a...
Use the t-distribution and the sample results to complete the test of the hypotheses. Use a 5% significance level. Assume the results come from a random sample, and if the sample size is small, assume the underlying distribution is relatively normal. Test H0 : μ=10 vs Ha : μ>10 using the sample results x¯=13.2, s=8.7, with n=12. test statistic = p-value =
Given the following hypotheses: H0: μ ≤ 13 H1: μ > 13 A random sample of...
Given the following hypotheses: H0: μ ≤ 13 H1: μ > 13 A random sample of 10 observations is selected from a normal population. The sample mean was 11 and the sample standard deviation 3.6. Using the 0.05 significance level: State the decision rule. (Round your answer to 3 decimal places.) Compute the value of the test statistic. (Negative answers should be indicated by a minus sign. Round your answer to 3 decimal places.) What is your decision regarding the...
Use the t-distribution and the sample results to complete the test of the hypotheses. Use a...
Use the t-distribution and the sample results to complete the test of the hypotheses. Use a 5% significance level. Assume the results come from a random sample, and if the sample size is small, assume the underlying distribution is relatively normal. Test H0 : μ=4 vs Ha : μ≠4 using the sample results x¯=4.8, s=2.3, with n=15. ME: 99% confidence interval
Given the following hypotheses: H0: μ ≥ 20 H1: μ > 10 A random sample of...
Given the following hypotheses: H0: μ ≥ 20 H1: μ > 10 A random sample of five resulted in the following values: 18, 15, 12, 19, and 21. Assume a normal population. Using the 0.01 significance level, can we conclude the population mean is less than 20? a). Compute the value of the test statistic. (Negative amount should be indicated by a minus sign. Round your answer to 2 decimal places.)
Using the following data set, conduct an independent samples t-test. Use a= 0.05 and a two-tailed...
Using the following data set, conduct an independent samples t-test. Use a= 0.05 and a two-tailed test. Sample 1: 14, 14, 13, 13, 10, 12, 14, 15, 17 Sample 2: 15, 11, 15, 13, 14, 13, 14, 14, 15 1. hypotheses: null and alternative 2. t-critical value; shade of regions of rejection 3. t-obtain 4. conclusion 5. decide if significant 6. compute for confidence interval is significant
Given the following hypotheses: Hy: 13 Hu> 13 A random sample of 10 observations is selected...
 Given the following hypotheses: Hy: 13 Hu> 13 A random sample of 10 observations is selected from a normal population. The sample mean was 12 and the sample standard deviation 4.3. Using the 0.1 significance level: a. State the decision rule. (Round your answer to 3 decimal places.) Reject HO ift b. Compute the value of the test statistic. (Negative answers should be indicated by a minus sign. Round your answer to 3 decimal places.) Value of the test statistic...
12 0 89 10 11 12 13 14 15 16 QUESTION 2 Increasing the sample size...
 12 0 89 10 11 12 13 14 15 16 QUESTION 2 Increasing the sample size a. Increases the power of the statistical test Ob. increases the degrees of freedom OC. changes the critical t value to determine significance O d. all of the above QUESTION 3 It is impossible to find a large effect size if your t-test results are not significant. True False QUESTION 4 P = .032 means there is a 3.2% chance the mean differences are...
A sample of 10 measurements consists of the following values: 15, 12, 13, 16, 11, 12,...
A sample of 10 measurements consists of the following values: 15, 12, 13, 16, 11, 12, 14, 15, 11, and 13. Can you use Tchebysheff's Theorem to describe this data set? Why or why not? a. No, the data is not mound-shaped. b. Yes, the data is not mound-shaped. c. No, the data is mound-shaped. d. Yes, the data is mound-shaped. e. No, not enough information is given to describe the data.
The one-sample t statistic from a sample of n = 13 observations for the two-sided test...
 The one-sample t statistic from a sample of n = 13 observations for the two-sided test of the following hypotheses has the value t 1.49. Hoi 64 H 64 (a) What are the degrees of freedom for t? df = (b) Locate the two critical values t from Table C that bracket t. (Use 3 decimal places.) <t What are the twwo-sided P-values for these two entries? <P-value 1.49 significant at the 10 % level? (d) Is the value t...
In order to test hypotheses H 0: μ = 70 ; H a: μ < 70....
In order to test hypotheses H 0: μ = 70 ; H a: μ < 70. A random sample of size 100 is taken . The sample yields x ¯ = 68 ; s = 8. Find the test statistic. Group of answer choices
 Given the following hypotheses: Hy: 13 Hu> 13 A random sample of 10 observations is selected from a normal population. The sample mean was 12 and the sample standard deviation 4.3. Using the 0.1 significance level: a. State the decision rule. (Round your answer to 3 decimal places.) Reject HO ift b. Compute the value of the test statistic. (Negative answers should be indicated by a minus sign. Round your answer to 3 decimal places.) Value of the test statistic...
 12 0 89 10 11 12 13 14 15 16 QUESTION 2 Increasing the sample size a. Increases the power of the statistical test Ob. increases the degrees of freedom OC. changes the critical t value to determine significance O d. all of the above QUESTION 3 It is impossible to find a large effect size if your t-test results are not significant. True False QUESTION 4 P = .032 means there is a 3.2% chance the mean differences are...
 The one-sample t statistic from a sample of n = 13 observations for the two-sided test of the following hypotheses has the value t 1.49. Hoi 64 H 64 (a) What are the degrees of freedom for t? df = (b) Locate the two critical values t from Table C that bracket t. (Use 3 decimal places.) <t What are the twwo-sided P-values for these two entries? <P-value 1.49 significant at the 10 % level? (d) Is the value t...
Most questions answered within 3 hours.
-
3) What are the typical social structures in a global city?
asked 1 minute from now -
Luther Corporation
Consolidated Balance Sheet
December 31, 2019 and 2018 (in $ millions)
Assets
2019
2018...
asked 18 seconds ago -
(Expected rate of return and risk) Carter Inc. is evaluating a
security. Calculate the investment’s expected...
asked 2 hours ago -
What specific indicators can point to lack of progress for
African Americans in American society?
asked 3 hours ago -
1-The Electrons in a beam are moving at 2.7×10⁸ m/s in an
electric field of 15000...
asked 3 hours ago -
A gas tank is a vertical cylinder. It has a radius of 1m, a
height of...
asked 4 hours ago -
Accent Software faces the following conditions. All of these
support Accent’s use of a market-penetration pricing...
asked 5 hours ago -
A mathematically inclined friend emails you the following
instructions: "Meet me in the cafeteria the first...
asked 5 hours ago -
A monopoly sells in two countries . The demand curves in the two
countries are p1...
asked 6 hours ago -
A .15kg rubber ball is bounced off a wall. Before hitting the
wall, the ball moves...
asked 7 hours ago -
A manufacturing company preparing to build a new plant is
considering three potential locations for it....
asked 7 hours ago -
B. If compound Y has approximately the same values of solubility
in toluene as compound X,...
asked 7 hours ago