
Homework Answers
Part 1 of 2: The probability distribution is:
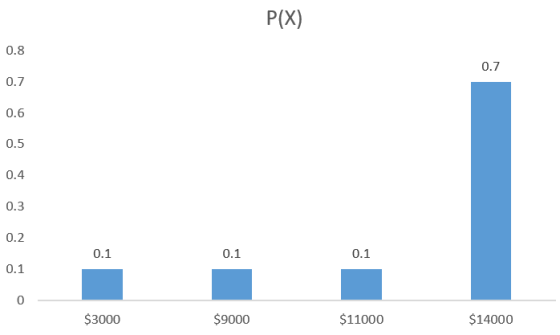
| X | P(X) |
| $3000 | 0.1 |
| $9000 | 0.1 |
| $11000 | 0.1 |
| $14000 | 0.7 |
Part 2 of 2: The graph of probability distribution is:
Add Answer to:
Investment Return Construct a probability distribution for the
data and draw a graph for the distribution....
A probability experiment is conducted. Which of these cannot be considered a probability outcome? A. O...
 A probability experiment is conducted. Which of these cannot be considered a probability outcome? A. O B. 1 C. 1.62 D. 0.55 E. 28% F. 155% G. -0.78 7 H. 8 Tutorial help If a die is rolled one time, find these probabilities. Enter your answers as fractions or as decimals rounded to 3 decimal places. Part 1 out of 3 Getting an even number. P(an even number) = CHECK NEXT Tutorial help If two dice are rolled one time,...
Use technology to (a) construct and graph a probability distribution and (b) describe its shape. The...
Use technology to (a) construct and graph a probability distribution and (b) describe its shape. The number of computers per household in a small town Computers 0 1 2 3 Households 302302 282282 9393 1616 (a) Construct the probability distribution by completing the table below. x P(x) 0 nothing 1 nothing 2 nothing 3 nothing (Round to three decimal places as needed.) Choose the correct graph of the probability distribution.
the more important If a die is rolled one time, find these probabilities. Enter your answers...
 the
more important
If a die is rolled one time, find these probabilities. Enter your answers as fractions or as decimals rounded to 3 decimal places. Part 1 out of 3 Getting an even number. P(an even number) = CHECK NEXT If two dice are rolled one time, find the probability of getting these results. Enter your answers as fractions or as decimals rounded to 3 decimal places. Part 1 out of 4 A sum of 7 P(sum of 7)...
the
more important
If a die is rolled one time, find these probabilities. Enter your answers as fractions or as decimals rounded to 3 decimal places. Part 1 out of 3 Getting an even number. P(an even number) = CHECK NEXT If two dice are rolled one time, find the probability of getting these results. Enter your answers as fractions or as decimals rounded to 3 decimal places. Part 1 out of 4 A sum of 7 P(sum of 7)...
An analyst has developed the following probability distribution for the rate of return for a common...
 An analyst has developed the following probability distribution for the rate of return for a common stock. Scenario Probability Rate of Return 0.24 0.47 0.29 -8% 2% 25% a. Calculate the expected rate of return. (Round intermediate calculations to at least 4 decimal places. Round your answer to 2 decimal places.) Expected rate of return b. Calculate the variance and the standard deviation of this probability distribution. (Use the percentage values for your calculations (for example 10% not 0.10). Round...
An analyst has developed the following probability distribution for the rate of return for a common...
 An analyst has developed the following probability distribution for the rate of return for a common stock. f Return 0.29 0.50 0.21 -17% 158 a. Calculate the expected rate of return. (Round intermediate calculations to at least 4 decimal places. Round your answer to 2 decimal places.) Expected rate of return b. Calculate the variance and the standard deviation of this probability distribution. (Use the percentage values for your calculations (for example 10% not 0.10). Round intermediate calculations to at...
An analyst has developed the following probability distribution for the rate of return for a common...
 An analyst has developed the following probability distribution for the rate of return for a common stock. Scenario Probability Rate of Return 0.24 0.47 0。29 -8% 2% 25% 2 a. Calculate the expected rate of return. (Round intermediate calculations to at least 4 decimal places. Round your answer to 2 decimal places.) Expected rate of 6271% b. Calculate the variance and the standard deviation of this probability distribution. (Use the percentage values for your (for example 10% not 0.10). Round...
An analyst has developed the following probability distribution of the rate of return for a common...
An analyst has developed the following probability distribution of the rate of return for a common stock. Scenario Probability Rate of Return 1 .30 -6% 2 .38 4% 3 .32 28% a. Calculate the expected rate of return. (Round your answer to 2 decimal places.) Expected rate of return % b. Calculate the variance and standard deviation of this probability distribution. (Round your intermediate calculations to 4 decimal places and final answers to 2 decimal places.) Variance Standard deviation
An analyst has developed the following probability distribution for the rate of return for a common...
 An analyst has developed the following probability distribution for the rate of return for a common stock. turn 0.29 0.50 0.21 -17% 78 15% a. Calculate the expected rate of return. (Round Intermediate calculations to at least 4 decimal places. Round your answer to 2 decimal places.) Expected rate of retun b. Calculate the varlance and the standard deviation of this probability distribution. (Use the percentage values for your calculations for example 10% not 0 Round intermediate calculations to at...
15. (10 points) A. Draw a graph of the probability distribution function (PDF) for the uniform di...
 15. (10 points) A. Draw a graph of the probability distribution function (PDF) for the uniform distribution that is defined to be non-zero and constant between 1 and 10. Label the x and y-axes for the graph. (3 points) B. On the same graph draw the cumulative distribution function (CDF) for the uniform distribution. Clearly identify each line (PDF or CDF) in the graph. (3 points) C. In words, express the mathematical relationship that exists between any CDF and the...
The graph of a probability distribution is shown below. The graph is made up of a...
 The graph of a probability distribution is shown below. The graph is made up of a line segment and two curved paths. 0.125 0 1 2 3 4 5 6 7 8 9 10 11 12 For each part below, suppose a real number is picked according to the above probability distribution. Do not round any of your answers. (a) Find the probability that the number picked is not between 4 and 7. X h ? 2 (b) Find the...
 A probability experiment is conducted. Which of these cannot be considered a probability outcome? A. O B. 1 C. 1.62 D. 0.55 E. 28% F. 155% G. -0.78 7 H. 8 Tutorial help If a die is rolled one time, find these probabilities. Enter your answers as fractions or as decimals rounded to 3 decimal places. Part 1 out of 3 Getting an even number. P(an even number) = CHECK NEXT Tutorial help If two dice are rolled one time,...
 the
more important
If a die is rolled one time, find these probabilities. Enter your answers as fractions or as decimals rounded to 3 decimal places. Part 1 out of 3 Getting an even number. P(an even number) = CHECK NEXT If two dice are rolled one time, find the probability of getting these results. Enter your answers as fractions or as decimals rounded to 3 decimal places. Part 1 out of 4 A sum of 7 P(sum of 7)...
the
more important
If a die is rolled one time, find these probabilities. Enter your answers as fractions or as decimals rounded to 3 decimal places. Part 1 out of 3 Getting an even number. P(an even number) = CHECK NEXT If two dice are rolled one time, find the probability of getting these results. Enter your answers as fractions or as decimals rounded to 3 decimal places. Part 1 out of 4 A sum of 7 P(sum of 7)...
 An analyst has developed the following probability distribution for the rate of return for a common stock. Scenario Probability Rate of Return 0.24 0.47 0.29 -8% 2% 25% a. Calculate the expected rate of return. (Round intermediate calculations to at least 4 decimal places. Round your answer to 2 decimal places.) Expected rate of return b. Calculate the variance and the standard deviation of this probability distribution. (Use the percentage values for your calculations (for example 10% not 0.10). Round...
 An analyst has developed the following probability distribution for the rate of return for a common stock. f Return 0.29 0.50 0.21 -17% 158 a. Calculate the expected rate of return. (Round intermediate calculations to at least 4 decimal places. Round your answer to 2 decimal places.) Expected rate of return b. Calculate the variance and the standard deviation of this probability distribution. (Use the percentage values for your calculations (for example 10% not 0.10). Round intermediate calculations to at...
 An analyst has developed the following probability distribution for the rate of return for a common stock. Scenario Probability Rate of Return 0.24 0.47 0。29 -8% 2% 25% 2 a. Calculate the expected rate of return. (Round intermediate calculations to at least 4 decimal places. Round your answer to 2 decimal places.) Expected rate of 6271% b. Calculate the variance and the standard deviation of this probability distribution. (Use the percentage values for your (for example 10% not 0.10). Round...
 An analyst has developed the following probability distribution for the rate of return for a common stock. turn 0.29 0.50 0.21 -17% 78 15% a. Calculate the expected rate of return. (Round Intermediate calculations to at least 4 decimal places. Round your answer to 2 decimal places.) Expected rate of retun b. Calculate the varlance and the standard deviation of this probability distribution. (Use the percentage values for your calculations for example 10% not 0 Round intermediate calculations to at...
 15. (10 points) A. Draw a graph of the probability distribution function (PDF) for the uniform distribution that is defined to be non-zero and constant between 1 and 10. Label the x and y-axes for the graph. (3 points) B. On the same graph draw the cumulative distribution function (CDF) for the uniform distribution. Clearly identify each line (PDF or CDF) in the graph. (3 points) C. In words, express the mathematical relationship that exists between any CDF and the...
 The graph of a probability distribution is shown below. The graph is made up of a line segment and two curved paths. 0.125 0 1 2 3 4 5 6 7 8 9 10 11 12 For each part below, suppose a real number is picked according to the above probability distribution. Do not round any of your answers. (a) Find the probability that the number picked is not between 4 and 7. X h ? 2 (b) Find the...
Most questions answered within 3 hours.
-
26) Briefly describe, using words or simple diagrams, the
chemiosmotic theory for coupling oxidation to phosphorylation...
asked 1 hour ago -
Suppose that XX is a random variable with mean 16 and standard
deviation 5 . Also...
asked 2 hours ago -
Calculate the number density of argon gas at a temperature of
24C and a pressure of...
asked 5 hours ago -
Alternative
Classification
How to Estimate
Probabilities from Data? ( For continuous Attributes)
And How to generate...
asked 5 hours ago -
An explosion breaks a 20.0-kg object into three parts. The
object is initially moving at a...
asked 6 hours ago -
Calculate the approximate number of residues of Rubisco, which
is involved in carbon fixation in plants,...
asked 7 hours ago -
Other decisions about scientific claims can have a much broader
impact.ENERGYarrow-10x10.png, environment, health, security - all...
asked 8 hours ago -
I need to write a research paper and work cited about this
topic: The United States...
asked 9 hours ago -
Hello! I was wondering if I could have some help?
If the vapor pressure of carvone...
asked 9 hours ago -
An economist wants to estimate the mean per capita income (in
thousands of dollars) for a...
asked 9 hours ago -
What would be the input/output characteristic of a circuit
obtained by putting two of your 2's-complementers...
asked 9 hours ago -
In Drosophila, the transition from the syncytial blastoderm
stage to the cellular blastoderm stage is a...
asked 10 hours ago