1. What are the main rules in making decisions concerning costs?
2. 
Homework Answers
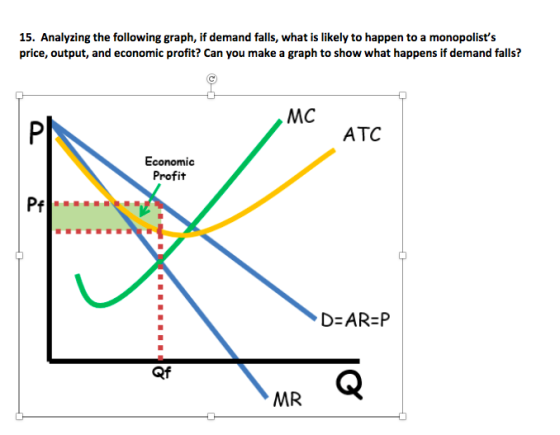
The effect of a decrease in demand on a monopolist are shown in the graph below. Explanation follows.

The new demand curve is shown in pink as Demand2. The new MR curve is shown in pink as MR2. As demand decreases, demand curve shifts to left. Similarly MR curve also changes, and is now lower.
The new quantity is where the new MR and Demand curves intersect. As can be seen, the new quantity Q2 is lower than earlier quantity. The corresponding price, P2, is also lower than earlier price.
So, Price, output and eocnomic profit all are now lesser.
Add Answer to:
1. What are the main rules in making decisions
concerning costs?
2.
15. Analyzing the following...
Price/Cost ($) 7) Monopoly II (6 points) The marginal costs (MC), average variable costs (AVC), and...
 Price/Cost ($) 7) Monopoly II (6 points) The marginal costs (MC), average variable costs (AVC), and average total costs (ATC) for a monopoly are shown in the figure below. The figure also shows the demand curve (D) and the marginal revenue curve (MR) for this market. 501 ATC AVC a. What is the firm's profit-maximizing level of output? Label this on the graph. b. What price will the monopolist charge for that level of output? Label this on the graph....
Graph Worksheet MC DI MR P4 ATC P3 P2 AVC PI 02 1. What is the...
 Graph Worksheet MC DI MR P4 ATC P3 P2 AVC PI 02 1. What is the price and quantity at the optimum level of production? Is this an economic profit, loss, or break-even? Should the firm produce? 2. If the industry model is monopolistic competition, what will happen to the industry? What will happen to the demand and marginal revenue curves for the individual firm? In the long run where will the demand curve be? Will the firm achieve productive...
Consider a competitive rm with total costs given by TC(q) = 100 + 10q + q^2,...
Consider a competitive rm with total costs given by TC(q) = 100 + 10q + q^2, The firm faces a market price p = 50. (a) Write expressions for total revenue TR and marginal revenue MR as functions of output q. (b) Write expressions for average total cost ATC, average variable cost AVC, and marginal cost MC as functions of output q. (c) For what value of output is ATC minimized? (d) Find the profit maximizing level of output q...
Graph Worksheet 01 02 03 1. What is the price and quantity at the optimum level...
 Graph Worksheet 01 02 03 1. What is the price and quantity at the optimum level of production? Is this an economic profit, loss, or break-even? Should the firm produce? 2. If the industry model is monopolistic competition, what will happen to the industry? What will happen to the demand and marginal revenue curves for the individual firm? In the long run, where will the demand curve be? Will the firm achieve productive and/or allocative efficiency? 3. If the industry...
Price MC ATC AVC - MR 40 45 47 Quantity a. (1 points) Using the graph...
 Price MC ATC AVC - MR 40 45 47 Quantity a. (1 points) Using the graph above, what is the profit maximizing or loss minimizing output and price? b. (1 point)Using the graph above, what is the profit or loss for the profit maximizing firm? c. (2 points) What would happen in this market in the long run. Be sure to explain in detail what happens in the market and the firm. What would be the long run price, and...
A monopolist faces a market demand curve given by
A monopolist faces a market demand curve given by Q=70-P a. If the monopolist can produce at constant average and marginal costs ofAC-MC-6, what output level will the monopolist choose to maximize profits? What is the price at this output level? What are the monopolist's profits? b. Assume instead that the monopolist has a cost structure where total costs are described by C(Q) = 0.25Q2 - 5Q + 300. With the monopolist facing the same market demand and marginal revenue, what price-quantity combination will be chosen now...
The market price is p=50 3. Consider a competitive firm with total costs given by TC(q)...
 The market price is p=50
3. Consider a competitive firm with total costs given by TC(q) = 100 + 10q+q? (e) Graph the ATC, AVC, MC, and MR curves in a single graph, and indicate the profit maximizing level of output. If there are profits, shade the region corre- sponding to profit and label it. (f) If fixed costs increase from 100 to 500, what happens to the profit maximizing level of output, TR, TC, and a? (g) If fixed...
The market price is p=50
3. Consider a competitive firm with total costs given by TC(q) = 100 + 10q+q? (e) Graph the ATC, AVC, MC, and MR curves in a single graph, and indicate the profit maximizing level of output. If there are profits, shade the region corre- sponding to profit and label it. (f) If fixed costs increase from 100 to 500, what happens to the profit maximizing level of output, TR, TC, and a? (g) If fixed...
The graph shows a monopolist's demand (D), marginal revenue (MR), marginal cost (MC), and average total cost (ATC) curves. Despite having the market all to itself, the firm has struggled to make money. Suppose that the firm is sold, and the new owner is i
 The graph shows a monopolist's demand (D), marginal revenue (MR), marginal cost (MC), and average total cost (ATC) curves. Despite having the market all to itself, the firm has struggled to make money. Suppose that the firm is sold, and the new owner is initially less intent on maximizing profits than on simply making a profit. What range of production quantities will allow the firm to operate while earning a profit?Give your answer by dragging the Qmin to Qmax lines into their correct...
The graph shows a monopolist's demand (D), marginal revenue (MR), marginal cost (MC), and average total...
 The graph shows a monopolist's demand (D), marginal revenue (MR), marginal cost (MC), and average total cost (ATC) curves. Despite having the market all to itself, the firm has struggled to make money. Suppose that the firm is sold,and the new owner is initially less intent on maximizing profits than on simply making a profit. What range of production quantities will low the frm to operate while earning a profit? Give your answer by those limits dragging the Qmin to...
 Price/Cost ($) 7) Monopoly II (6 points) The marginal costs (MC), average variable costs (AVC), and average total costs (ATC) for a monopoly are shown in the figure below. The figure also shows the demand curve (D) and the marginal revenue curve (MR) for this market. 501 ATC AVC a. What is the firm's profit-maximizing level of output? Label this on the graph. b. What price will the monopolist charge for that level of output? Label this on the graph....
 Graph Worksheet MC DI MR P4 ATC P3 P2 AVC PI 02 1. What is the price and quantity at the optimum level of production? Is this an economic profit, loss, or break-even? Should the firm produce? 2. If the industry model is monopolistic competition, what will happen to the industry? What will happen to the demand and marginal revenue curves for the individual firm? In the long run where will the demand curve be? Will the firm achieve productive...
 Graph Worksheet 01 02 03 1. What is the price and quantity at the optimum level of production? Is this an economic profit, loss, or break-even? Should the firm produce? 2. If the industry model is monopolistic competition, what will happen to the industry? What will happen to the demand and marginal revenue curves for the individual firm? In the long run, where will the demand curve be? Will the firm achieve productive and/or allocative efficiency? 3. If the industry...
 Price MC ATC AVC - MR 40 45 47 Quantity a. (1 points) Using the graph above, what is the profit maximizing or loss minimizing output and price? b. (1 point)Using the graph above, what is the profit or loss for the profit maximizing firm? c. (2 points) What would happen in this market in the long run. Be sure to explain in detail what happens in the market and the firm. What would be the long run price, and...
 The market price is p=50
3. Consider a competitive firm with total costs given by TC(q) = 100 + 10q+q? (e) Graph the ATC, AVC, MC, and MR curves in a single graph, and indicate the profit maximizing level of output. If there are profits, shade the region corre- sponding to profit and label it. (f) If fixed costs increase from 100 to 500, what happens to the profit maximizing level of output, TR, TC, and a? (g) If fixed...
The market price is p=50
3. Consider a competitive firm with total costs given by TC(q) = 100 + 10q+q? (e) Graph the ATC, AVC, MC, and MR curves in a single graph, and indicate the profit maximizing level of output. If there are profits, shade the region corre- sponding to profit and label it. (f) If fixed costs increase from 100 to 500, what happens to the profit maximizing level of output, TR, TC, and a? (g) If fixed...
 The graph shows a monopolist's demand (D), marginal revenue (MR), marginal cost (MC), and average total cost (ATC) curves. Despite having the market all to itself, the firm has struggled to make money. Suppose that the firm is sold,and the new owner is initially less intent on maximizing profits than on simply making a profit. What range of production quantities will low the frm to operate while earning a profit? Give your answer by those limits dragging the Qmin to...
Most questions answered within 3 hours.
-
A lottery exists where balls numbered 1 to 17 are placed in an
urn. To win,...
asked 48 minutes ago -
Please explain steps:
An 80 kg swimmer steps off a platform 10 m above the water...
asked 45 minutes ago -
26) Briefly describe, using words or simple diagrams, the
chemiosmotic theory for coupling oxidation to phosphorylation...
asked 2 hours ago -
Suppose that XX is a random variable with mean 16 and standard
deviation 5 . Also...
asked 3 hours ago -
Calculate the number density of argon gas at a temperature of
24C and a pressure of...
asked 6 hours ago -
Alternative
Classification
How to Estimate
Probabilities from Data? ( For continuous Attributes)
And How to generate...
asked 6 hours ago -
An explosion breaks a 20.0-kg object into three parts. The
object is initially moving at a...
asked 7 hours ago -
Calculate the approximate number of residues of Rubisco, which
is involved in carbon fixation in plants,...
asked 8 hours ago -
Other decisions about scientific claims can have a much broader
impact.ENERGYarrow-10x10.png, environment, health, security - all...
asked 9 hours ago -
I need to write a research paper and work cited about this
topic: The United States...
asked 9 hours ago -
Hello! I was wondering if I could have some help?
If the vapor pressure of carvone...
asked 10 hours ago -
An economist wants to estimate the mean per capita income (in
thousands of dollars) for a...
asked 10 hours ago