I need help on how to find the atmospheric pressure from the scatter plot and trend line I made with the results from my Boyle's Law lab. I don't know if my scatter plot is correct. I need the atmospheric pressure in order to fill in Table 5 and answer some questions.
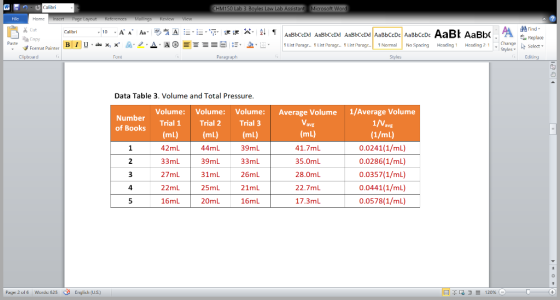
24. Use the data in Data Table 1 and Data Table 3 to create a scatter-plot graph of 1/Average Volume vs. Pressure; with “1/Average Volume (mL-1)” on the x-axis and “Pressure (Pa)” on the y-axis.
25. Add a linear trend-line to the scatter-plot, and display the equation of the line on the graph (this is a typical function of graphing programs).
26. Resize and insert an image of the graph into Data Table 4. 27. Use the equation of the line to determine atmospheric pressure; As the trend-line equation is displayed as y=mx + b, b is the value where y is 0, thus the absolute value of b is roughly representative of atmospheric pressure. Record the “atmospheric pressure” into Data Table 5 of your Lab Report Assistant.
27. Use the equation of the line to determine atmospheric pressure; As the trend-line equation is displayed as y=mx + b, b is the value where y is 0, thus the absolute value of b is roughly representative of atmospheric pressure. Record the “atmospheric pressure” into Data Table 5 of your Lab Report Assistant.
(This graph is created with the results from my chem lab and I'm not sure if I should make the trend line starting at 0)


28. For each number of books calculate the total pressure, by adding the atmospheric pressure to the pressure values in Data Table 1. Record the total pressure for each number of books in Data Table 5.
29. Calculate the product of “Total Pressure” multiplied by the “Average Volume” for each number of books and record in Data Table 5. Relating this back to the information presented in the Background section, Boyle’s law is written as PV = k, therefore the values calculated in this step represent the constant (k) in Boyle’s law.

Questions:
(A)

***(Atmospheric pressure in NJ is 101,014.17 pa) --> I need this to answer the question (A) above
(B) As stated by Boyle’s Law, the products PV should equal a constant, k. Did your results of Pt × Vavg come out approximately the same for k?
Homework Answers
When the book is placed on the object, the pressure it experiences is due to the weight of the object, plus the atmospheric weight. Hence the change in volume is due to the net pressure.
So, we can write, the net pressure Pt = Po + P where Po is the atmospheric pressure and P is pressure due to the object.
Now, Boyle's Law states that PV is a constant.
Let the constant be k. Then,
Pt x V = k
(Po + P) x V =k
or P = (k/V) - Po
This is of the form y=mx+b
where y =P , x= (1/V), m =k and b = -Po
Hence the y intercept (the point where x =0) gives -Po .
For your data, the scatter plot looks like,

The equation is of the form

Hence Po = -b = 35016 Pa
| Final Pressure Pt in Pa | Pt x Vavg in Pa mL |
| 56872.76 | 2359866 |
| 78994.78 | 2762055 |
| 107098.2 | 2999950 |
| 128437.8 | 2899272 |
| 151196.4 | 2615854 |
Add Answer to:
I need help on how to find the atmospheric pressure from the
scatter plot and trend...
I need help please LAB XV. BOYLE'S LAW DATA SHEET NAME: 1. Atmospheric Pressure, mmHg 2....
 I need help please
LAB XV. BOYLE'S LAW DATA SHEET NAME: 1. Atmospheric Pressure, mmHg 2. Atmospheric Pressure, atm 3, Room Temperature, ? 4. Room Temperature, K 5. What variables are plotted in each curved graph? (Keyboard, Khd, is not a variable). SECTION: 892x The relationship demonstrated in this experiment in each of these curved graphs is: As increases, (variable) (variable) (increases, decreases) 6. What variables are plotted in each of the "linear" graphs? What relationship is demonstrated in each...
I need help please
LAB XV. BOYLE'S LAW DATA SHEET NAME: 1. Atmospheric Pressure, mmHg 2. Atmospheric Pressure, atm 3, Room Temperature, ? 4. Room Temperature, K 5. What variables are plotted in each curved graph? (Keyboard, Khd, is not a variable). SECTION: 892x The relationship demonstrated in this experiment in each of these curved graphs is: As increases, (variable) (variable) (increases, decreases) 6. What variables are plotted in each of the "linear" graphs? What relationship is demonstrated in each...
Data Collecting hydrogen gas from the reaction of Mg with HCI Trial 1 Trial 2 Trial 3 Atmospheric pressure (in Hg)...
 Data Collecting hydrogen gas from the reaction of Mg with HCI Trial 1 Trial 2 Trial 3 Atmospheric pressure (in Hg) O pen Mass Mg ribbon 0.069 1.osa. 1.069 Volume Ha collected (ml) sim 40 mL de ML Temperature of water (°C) 23 с әət 1 22oC Vapor pressure of water (Table 10.1) 19.8WHO 19.8 mmHg 1.8 in Ho Atmospheric pressure (mm Hg) Partial pressure of H2 Temperature of water (K) Volume of H: collected (L) Moles Hz Theoretical moles...
About Excel, I have this data but how can I change the origin so 0,0 is not on the outside corner like it is in the righ...
 About Excel,
I have this data but how can I change the origin so 0,0 is not
on the outside corner like it is in the right-side picture and make
it inside the graph area like the left-side picture?
Tue Jun 4 23:25:17 Q E Word File Tools Table Window Help 100 % E. Edit View Insert Format thesis,pdf (page 22 of 29) thasis.pdf hue lig -Saved to my Mac summary of. Search in Document AutoSa 150 Home Insert Draw...
About Excel,
I have this data but how can I change the origin so 0,0 is not
on the outside corner like it is in the right-side picture and make
it inside the graph area like the left-side picture?
Tue Jun 4 23:25:17 Q E Word File Tools Table Window Help 100 % E. Edit View Insert Format thesis,pdf (page 22 of 29) thasis.pdf hue lig -Saved to my Mac summary of. Search in Document AutoSa 150 Home Insert Draw...
Lab 11: The Reaction of Magnesium with Hydrochloric Acid Using data from page 111, I need...
 Lab 11: The Reaction of Magnesium with Hydrochloric Acid
Using data from page 111, I need help with the calculations on
page 112
Purpose: Data: Trial 1 1 Trial 2 Trial 3 Mass Mg (9) Temperature (°C) 149 1.169 illg. 122.50€ 22,4€ 20.2°c) 2044in 20:32. in 19.83 in Atmospheric Pressure (inches Hg) 5 Vapor Pressure of water (mm Hg) from chart Volume of Ha collected (ml) 76.01 m. 118.2mL 90. SmL Results Trial 1 Trial 2 Trial 3 1. Moles...
Lab 11: The Reaction of Magnesium with Hydrochloric Acid
Using data from page 111, I need help with the calculations on
page 112
Purpose: Data: Trial 1 1 Trial 2 Trial 3 Mass Mg (9) Temperature (°C) 149 1.169 illg. 122.50€ 22,4€ 20.2°c) 2044in 20:32. in 19.83 in Atmospheric Pressure (inches Hg) 5 Vapor Pressure of water (mm Hg) from chart Volume of Ha collected (ml) 76.01 m. 118.2mL 90. SmL Results Trial 1 Trial 2 Trial 3 1. Moles...
I need help finding bile salt/ dye tolerant. DUIDULADOURI REPURT TEMPLATE 2013 Home Mailings Review Comments...
 I need help finding bile salt/ dye tolerant.
DUIDULADOURI REPURT TEMPLATE 2013 Home Mailings Review Comments Insert Draw Cambria BIU Design 11 , Layout References A A Aa A ADA > L SEO Share A Pasta 4 Styles Styles Pane EXPERIMENT# MACCONKEY AGAR PURPOSE: To become familiar with the use and function of specialized media for selection and differentiation of microorganisms. BACTERIA USED: Salmonella typhimurlum, Bacillus cereus, and Escherichia coll MATERIALS AND METHODS: Summarize methods used in this section. see...
I need help finding bile salt/ dye tolerant.
DUIDULADOURI REPURT TEMPLATE 2013 Home Mailings Review Comments Insert Draw Cambria BIU Design 11 , Layout References A A Aa A ADA > L SEO Share A Pasta 4 Styles Styles Pane EXPERIMENT# MACCONKEY AGAR PURPOSE: To become familiar with the use and function of specialized media for selection and differentiation of microorganisms. BACTERIA USED: Salmonella typhimurlum, Bacillus cereus, and Escherichia coll MATERIALS AND METHODS: Summarize methods used in this section. see...
I need help finding 1/ Average volume 1/V avg (1/mL). This is for a lab observing...
 I need help finding 1/ Average volume 1/V avg (1/mL). This is
for a lab observing Boyle’s Law.
xperiment1 TData Table 2 T Data Table 3 I Data Table 4 Graph 1 Graph 2 m Data Table 1 ata Table 4: Volume and Inverse Volume Book # Volume: Trial 1 mL) /Average Volume 1Ng (/m Average Volume Vavg mL) 56 109 158 204 247 olume: Trial 3 (mL 56 Volume: Trial 2 (ml 57 113 56 107 1,2,3 155 12.34...
I need help finding 1/ Average volume 1/V avg (1/mL). This is
for a lab observing Boyle’s Law.
xperiment1 TData Table 2 T Data Table 3 I Data Table 4 Graph 1 Graph 2 m Data Table 1 ata Table 4: Volume and Inverse Volume Book # Volume: Trial 1 mL) /Average Volume 1Ng (/m Average Volume Vavg mL) 56 109 158 204 247 olume: Trial 3 (mL 56 Volume: Trial 2 (ml 57 113 56 107 1,2,3 155 12.34...
AutoSave OFF Aos 50 CHEM101L-Lab Report 6 - Calorimetry - Saved to my Macy Home Layout...
 AutoSave OFF Aos 50 CHEM101L-Lab Report 6 - Calorimetry - Saved to my Macy Home Layout Tell me Share Comments Insert Draw Design Layout References Mailings Review View Cambria 12 AA Aa A E EVEU BI U ab x, x A LA EEEE E Table Design ALT D AaBbCcDdEe AaBbCcDdee AaBbCcDc AaBbCcDdEt AaBb No Spacing Heading 1 Heading 2 Title Paste Normal Styles Pane Dictate Heat of solution of a salt Salt name: Potassium Iodide (KI) Trial 1 75.00 ml...
Y=-54.068x-1.4269. Using the equation I need help filling in the blanks Bookl Excel Insert Page Layout...
 Y=-54.068x-1.4269. Using the equation I need help filling in
the blanks
Bookl Excel Insert Page Layout Formulas Data Review View ACROBAT Calibri Formatting Table Styles- Stylet Clipbeard Font 113 1 1/T Ln Ksp 0.031934 0.0031432 0.0030945 0.0030474 0.003016 3.1466 3.2597 1.8061 -0.72397 10 Ln Ksp 12 .0050010015 0020025 003 0035 0.5 Plot Area 15 1.5 17 19 20 21 2.5 -54 068x-1 4269 233.5 R 0 2992 27 31 32 36 Sheetl AIP/R (from data plot) O/R (from data plot...
Y=-54.068x-1.4269. Using the equation I need help filling in
the blanks
Bookl Excel Insert Page Layout Formulas Data Review View ACROBAT Calibri Formatting Table Styles- Stylet Clipbeard Font 113 1 1/T Ln Ksp 0.031934 0.0031432 0.0030945 0.0030474 0.003016 3.1466 3.2597 1.8061 -0.72397 10 Ln Ksp 12 .0050010015 0020025 003 0035 0.5 Plot Area 15 1.5 17 19 20 21 2.5 -54 068x-1 4269 233.5 R 0 2992 27 31 32 36 Sheetl AIP/R (from data plot) O/R (from data plot...
i need help for page 96. the info you requested is on page 95. Cveni hass...
 i need help for page 96. the info you requested is on
page 95.
Cveni hass Tablet3-0ea5 iet Sample 0.a4764 Somal Tanes 23. 9 Pessue125-0 teir -o.95894 -9539 A QUESTIONS 10. Using your answer to problem 1, the theoretical per cent of HCO, in an alka-seltzer tablet, answer the following. A student weighed an alka-seltzer tablet at 3.0625g, He then broke a sample weighing 0,2478 g from that tablet to run the exneriment exactly as it was run in this...
i need help for page 96. the info you requested is on
page 95.
Cveni hass Tablet3-0ea5 iet Sample 0.a4764 Somal Tanes 23. 9 Pessue125-0 teir -o.95894 -9539 A QUESTIONS 10. Using your answer to problem 1, the theoretical per cent of HCO, in an alka-seltzer tablet, answer the following. A student weighed an alka-seltzer tablet at 3.0625g, He then broke a sample weighing 0,2478 g from that tablet to run the exneriment exactly as it was run in this...
010 Datasheet and calculations Record the change pressure that occurred during the reaction and the mewn...
 010 Datasheet and calculations Record the change pressure that occurred during the reaction and the mewn m water bath in your data table ature of the Volume of Flask, ml. 260 mL Mass of metal (Mg) in 666 af 0.047 0.030 y A. Max Pressure in Nask, in kPa or at 111.73 104.30 B Atmospheric pressure, (starting pressure). or in kPa or at P 102.60 102.10 Change in pressure or hydrogen gas. in kPa or atm (A-B) 9.13 kPa |...
 I need help please
LAB XV. BOYLE'S LAW DATA SHEET NAME: 1. Atmospheric Pressure, mmHg 2. Atmospheric Pressure, atm 3, Room Temperature, ? 4. Room Temperature, K 5. What variables are plotted in each curved graph? (Keyboard, Khd, is not a variable). SECTION: 892x The relationship demonstrated in this experiment in each of these curved graphs is: As increases, (variable) (variable) (increases, decreases) 6. What variables are plotted in each of the "linear" graphs? What relationship is demonstrated in each...
I need help please
LAB XV. BOYLE'S LAW DATA SHEET NAME: 1. Atmospheric Pressure, mmHg 2. Atmospheric Pressure, atm 3, Room Temperature, ? 4. Room Temperature, K 5. What variables are plotted in each curved graph? (Keyboard, Khd, is not a variable). SECTION: 892x The relationship demonstrated in this experiment in each of these curved graphs is: As increases, (variable) (variable) (increases, decreases) 6. What variables are plotted in each of the "linear" graphs? What relationship is demonstrated in each...
 Data Collecting hydrogen gas from the reaction of Mg with HCI Trial 1 Trial 2 Trial 3 Atmospheric pressure (in Hg) O pen Mass Mg ribbon 0.069 1.osa. 1.069 Volume Ha collected (ml) sim 40 mL de ML Temperature of water (°C) 23 с әət 1 22oC Vapor pressure of water (Table 10.1) 19.8WHO 19.8 mmHg 1.8 in Ho Atmospheric pressure (mm Hg) Partial pressure of H2 Temperature of water (K) Volume of H: collected (L) Moles Hz Theoretical moles...
 About Excel,
I have this data but how can I change the origin so 0,0 is not
on the outside corner like it is in the right-side picture and make
it inside the graph area like the left-side picture?
Tue Jun 4 23:25:17 Q E Word File Tools Table Window Help 100 % E. Edit View Insert Format thesis,pdf (page 22 of 29) thasis.pdf hue lig -Saved to my Mac summary of. Search in Document AutoSa 150 Home Insert Draw...
About Excel,
I have this data but how can I change the origin so 0,0 is not
on the outside corner like it is in the right-side picture and make
it inside the graph area like the left-side picture?
Tue Jun 4 23:25:17 Q E Word File Tools Table Window Help 100 % E. Edit View Insert Format thesis,pdf (page 22 of 29) thasis.pdf hue lig -Saved to my Mac summary of. Search in Document AutoSa 150 Home Insert Draw...
 Lab 11: The Reaction of Magnesium with Hydrochloric Acid
Using data from page 111, I need help with the calculations on
page 112
Purpose: Data: Trial 1 1 Trial 2 Trial 3 Mass Mg (9) Temperature (°C) 149 1.169 illg. 122.50€ 22,4€ 20.2°c) 2044in 20:32. in 19.83 in Atmospheric Pressure (inches Hg) 5 Vapor Pressure of water (mm Hg) from chart Volume of Ha collected (ml) 76.01 m. 118.2mL 90. SmL Results Trial 1 Trial 2 Trial 3 1. Moles...
Lab 11: The Reaction of Magnesium with Hydrochloric Acid
Using data from page 111, I need help with the calculations on
page 112
Purpose: Data: Trial 1 1 Trial 2 Trial 3 Mass Mg (9) Temperature (°C) 149 1.169 illg. 122.50€ 22,4€ 20.2°c) 2044in 20:32. in 19.83 in Atmospheric Pressure (inches Hg) 5 Vapor Pressure of water (mm Hg) from chart Volume of Ha collected (ml) 76.01 m. 118.2mL 90. SmL Results Trial 1 Trial 2 Trial 3 1. Moles...
 I need help finding bile salt/ dye tolerant.
DUIDULADOURI REPURT TEMPLATE 2013 Home Mailings Review Comments Insert Draw Cambria BIU Design 11 , Layout References A A Aa A ADA > L SEO Share A Pasta 4 Styles Styles Pane EXPERIMENT# MACCONKEY AGAR PURPOSE: To become familiar with the use and function of specialized media for selection and differentiation of microorganisms. BACTERIA USED: Salmonella typhimurlum, Bacillus cereus, and Escherichia coll MATERIALS AND METHODS: Summarize methods used in this section. see...
I need help finding bile salt/ dye tolerant.
DUIDULADOURI REPURT TEMPLATE 2013 Home Mailings Review Comments Insert Draw Cambria BIU Design 11 , Layout References A A Aa A ADA > L SEO Share A Pasta 4 Styles Styles Pane EXPERIMENT# MACCONKEY AGAR PURPOSE: To become familiar with the use and function of specialized media for selection and differentiation of microorganisms. BACTERIA USED: Salmonella typhimurlum, Bacillus cereus, and Escherichia coll MATERIALS AND METHODS: Summarize methods used in this section. see...
 I need help finding 1/ Average volume 1/V avg (1/mL). This is
for a lab observing Boyle’s Law.
xperiment1 TData Table 2 T Data Table 3 I Data Table 4 Graph 1 Graph 2 m Data Table 1 ata Table 4: Volume and Inverse Volume Book # Volume: Trial 1 mL) /Average Volume 1Ng (/m Average Volume Vavg mL) 56 109 158 204 247 olume: Trial 3 (mL 56 Volume: Trial 2 (ml 57 113 56 107 1,2,3 155 12.34...
I need help finding 1/ Average volume 1/V avg (1/mL). This is
for a lab observing Boyle’s Law.
xperiment1 TData Table 2 T Data Table 3 I Data Table 4 Graph 1 Graph 2 m Data Table 1 ata Table 4: Volume and Inverse Volume Book # Volume: Trial 1 mL) /Average Volume 1Ng (/m Average Volume Vavg mL) 56 109 158 204 247 olume: Trial 3 (mL 56 Volume: Trial 2 (ml 57 113 56 107 1,2,3 155 12.34...
 AutoSave OFF Aos 50 CHEM101L-Lab Report 6 - Calorimetry - Saved to my Macy Home Layout Tell me Share Comments Insert Draw Design Layout References Mailings Review View Cambria 12 AA Aa A E EVEU BI U ab x, x A LA EEEE E Table Design ALT D AaBbCcDdEe AaBbCcDdee AaBbCcDc AaBbCcDdEt AaBb No Spacing Heading 1 Heading 2 Title Paste Normal Styles Pane Dictate Heat of solution of a salt Salt name: Potassium Iodide (KI) Trial 1 75.00 ml...
 Y=-54.068x-1.4269. Using the equation I need help filling in
the blanks
Bookl Excel Insert Page Layout Formulas Data Review View ACROBAT Calibri Formatting Table Styles- Stylet Clipbeard Font 113 1 1/T Ln Ksp 0.031934 0.0031432 0.0030945 0.0030474 0.003016 3.1466 3.2597 1.8061 -0.72397 10 Ln Ksp 12 .0050010015 0020025 003 0035 0.5 Plot Area 15 1.5 17 19 20 21 2.5 -54 068x-1 4269 233.5 R 0 2992 27 31 32 36 Sheetl AIP/R (from data plot) O/R (from data plot...
Y=-54.068x-1.4269. Using the equation I need help filling in
the blanks
Bookl Excel Insert Page Layout Formulas Data Review View ACROBAT Calibri Formatting Table Styles- Stylet Clipbeard Font 113 1 1/T Ln Ksp 0.031934 0.0031432 0.0030945 0.0030474 0.003016 3.1466 3.2597 1.8061 -0.72397 10 Ln Ksp 12 .0050010015 0020025 003 0035 0.5 Plot Area 15 1.5 17 19 20 21 2.5 -54 068x-1 4269 233.5 R 0 2992 27 31 32 36 Sheetl AIP/R (from data plot) O/R (from data plot...
 i need help for page 96. the info you requested is on
page 95.
Cveni hass Tablet3-0ea5 iet Sample 0.a4764 Somal Tanes 23. 9 Pessue125-0 teir -o.95894 -9539 A QUESTIONS 10. Using your answer to problem 1, the theoretical per cent of HCO, in an alka-seltzer tablet, answer the following. A student weighed an alka-seltzer tablet at 3.0625g, He then broke a sample weighing 0,2478 g from that tablet to run the exneriment exactly as it was run in this...
i need help for page 96. the info you requested is on
page 95.
Cveni hass Tablet3-0ea5 iet Sample 0.a4764 Somal Tanes 23. 9 Pessue125-0 teir -o.95894 -9539 A QUESTIONS 10. Using your answer to problem 1, the theoretical per cent of HCO, in an alka-seltzer tablet, answer the following. A student weighed an alka-seltzer tablet at 3.0625g, He then broke a sample weighing 0,2478 g from that tablet to run the exneriment exactly as it was run in this...
 010 Datasheet and calculations Record the change pressure that occurred during the reaction and the mewn m water bath in your data table ature of the Volume of Flask, ml. 260 mL Mass of metal (Mg) in 666 af 0.047 0.030 y A. Max Pressure in Nask, in kPa or at 111.73 104.30 B Atmospheric pressure, (starting pressure). or in kPa or at P 102.60 102.10 Change in pressure or hydrogen gas. in kPa or atm (A-B) 9.13 kPa |...
Most questions answered within 3 hours.
-
What is the molarity of a solution made up of 82.5g of
Al(NO3)3 in 279 mL...
asked 36 seconds ago -
4) An astronaut standing at radius R1 on the inner ring of this
space station moves...
asked 44 seconds ago -
identify and explain the main four types of financial market.
(20 marks)
asked 5 minutes ago -
If a dominant firm is charged with refusal to deal under
antitrust law, it is being...
asked 4 minutes ago -
The magnetic field 39.0 cm away from a long, straight wire
carrying current 4.00 A is...
asked 6 minutes ago -
This is a question for Toxicology, it asks about the absorbtion,
biotransformation and excretion of a...
asked 8 minutes ago -
Various investment vehicles are available to assist in reaching
financial goals such as retirement or saving...
asked 9 minutes ago -
After one round of replication in 14-N media for the Meselson
Stahl experiment, scientists could conclude...
asked 22 minutes ago -
Shanghai Company sells glasses, fine china, and everyday
dinnerware. It uses activity-based costing to determine the...
asked 26 minutes ago -
how
does the process of separation of powers function in the united
states, what are its...
asked 26 minutes ago -
If you calculated the concentration of β-carotene in your 2.50
mL sample to be 2.389 ×...
asked 30 minutes ago -
During the current year D sold a property in class 12 for
$9,000. The property had...
asked 40 minutes ago