
Homework Answers
(1) I have solved this question using M.S.Excel -2016.
Firstly put all the data in excel.To get the 70th percentile value use the "=PERCENTILE.EXC( Array, k)" function in excel. In array give the location of your data and in the place of k put 0.7.

(2) To identify the outliers we will firstly find the Minimum value, 1st quartile value, Median , 3rd quartile value and maximum value.
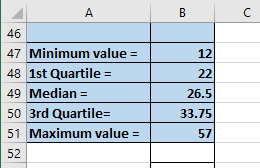
Here I have used ="QUARTILE(array, k) function. In the place of array give the range of the data and for in the place of k, for minimum value give 0, for 1st quartile give 1, for Median give 2, for 3rd quartile give 3 and for maximum value give 4.
Now we will find Inter quartile range(IQR) = Q3 - Q1
IQR = 33.75 - 22 = 11.75
Lower Fence = Q1 - 1.5(IQR)
= 22 - (1.5 11.75)
= 4.375
11.75)
= 4.375
Upper Fence = Q3 + 1.5(IQR)
= 33.75 + (1.5
11.75) = 51.37
Hence, any value within the data set lie outside the limit ( 4.375 , 51.37) will be consider as an Outlier.
In our data set there is only one data point, 57 that is lying outside the upper fence limit.
So, 57 is an outlier.
(3)

The median of the distribution = 26.5
Mean = Average of the data set = 27.625
Mode = 27
Here we can see that mean, median and mode are approximately equal to each other. Hence we can say that the shape of the distribution is approximately Normal.
Add Answer to:
1 The following data represents the number of innings pitched by the ERA leaders for the...
For each variable of interest, do the following: 1. Find the mean, five-number summary, range, variance,...
For each variable of interest, do the following: 1. Find the mean, five-number summary, range, variance, and standard deviation. Display these numbers in a format that is easy to understand. 2. For each variable of interest, use its five-number summary to construct a boxplot. Each boxplot must be constructed horizontally, and must be accompanied by a brief descriptive paragraph that assesses whether the data appear to be symmetrical, left-skewed, or right-skewed. Construct a 95% confidence interval for the mean μ...
The following data represents the number of consecutive minutes (to the nearest minute) 2. spent on...
 The following data represents the number of consecutive minutes (to the nearest minute) 2. spent on mobile phones by students attending the University of A. 23 2 26 40 22 52 28 40 19 55 50 52 51 46 51 60 59 45 26 2 48 1 34 10 18 45 29 41 11 43 50 32 37 15 57 17 57 35 50 45 7 22 15 13 20 13 15 32 13 39 25 38 31 16 7...
These are my instructions: Your data should have been read in from the data file and stored into ...
These are my instructions: Your data should have been read in from the data file and stored into an array. Next you need to calculate the following and display in a single Message box: Average score Highest score Lowest score Mode of the scores Your program should be written using methods and should be well documented internally and externally. Your output should be displayed using Message boxes. This is the .text file to use with the instructions: 20 21 22...
Once you have the dataset, please use knowledge gained in other business and/or economics classes to...
Once you have the dataset, please use knowledge gained in other business and/or economics classes to realize what topic and theory the data could relate and a research question that it could allow you to answer. More specifically, please put together an analysis by making sure your project report includes the following 1. Make a decision about the null and research hypothesis by comparing the obtained value to the critical value and interpret the results of the data. You can...
Using the data in the file named “Dataset 1,” to determine is there was a change...
Using the data in the file named “Dataset 1,” to determine is there was a change in the number of tons of paper used after the implementation of a recycling program in 25 different districts. a. Is this study using dependent or independent samples? b. What is your research hypothesis? c. Using Excel, calculate your test statistic and p-value. Paste the output here. d. What do you conclude? Below is the data set that is mentioned above Before Recycling 20...
The data represent the age of world leaders on their day of inauguration Find the five-number...
 The data represent the age of world leaders on their day of inauguration Find the five-number summary, and construct a poxplot for the data. Comment on the shape 57 of the distribution ummary is0000 Choose the correct boxplot of the data below O B. Choose the correct description of the shape of the distribution OA· The distribution is skewed to the right O B. The distribution is roughly symmetric O c. The distribution is skewed to the lef O D....
Sample Data Sample Data Hour Sample Taken Hour Sample Taken 1 4 5 X 1 3...
 Sample Data Sample Data Hour Sample Taken Hour Sample Taken 1 4 5 X 1 3 1 42 2 3 4 5 6 2 39 36 25 60 28 53 22 56 41 34 43 45 59 42 36 40 45 39 48 26 42 34 61 48 45 29 3 31 61 38 40 54 26 38 42 37 41 53 37 47 41 37 29 20 26 43 38 33 37 37 35 33 36 41 25 37...
The accounts manager of a large retail store is investigating the number of days that customers...
 The accounts manager of a large retail store is investigating the number of days that customers take to pay their invoices, the normal period being 30 days. An inspection of the payment records of 30 randomly- selected customers, revealed the following payment pattern. 35 42 34 27 32 30 24 33 27 36 30 38 26 32 28 28 39 23 17 20 31 29 30 24 25 29 31 30 19 34 1.1 Using 7 classes, each of width...
The following data was recorded for the "Age" of the various participants in a sports activity...
The following data was recorded for the "Age" of the various participants in a sports activity at a community centre. Age: 20 32 36 37 29 20 27 30 25 37 22 20 20 36 38 32 35 25 24 32 20 27 23 26 28 Use MiniTab to obtain the answers to following questions and draw the required diagrams. a. Find values of Mean, Variance and Standard Deviation using MiniTab. Simply write down the actual formulas for these three...
Caffeine: Following are the number of grams of carbohydrates in 12-ounce espresso beverages offered at a...
Caffeine: Following are the number of grams of carbohydrates in 12-ounce espresso beverages offered at a coffee shop. Construct a boxplot for these data. The first quartile is 26, median is 32, and third quartile is 35. 10 32 28 26 48 33 35 50 32 35 30 34 32 15 38 36 27 15 17 33 26 37 20 31 Send data to Excel Construct a boxplot for the given data (including outliers if any). 5101520253035404550
 The following data represents the number of consecutive minutes (to the nearest minute) 2. spent on mobile phones by students attending the University of A. 23 2 26 40 22 52 28 40 19 55 50 52 51 46 51 60 59 45 26 2 48 1 34 10 18 45 29 41 11 43 50 32 37 15 57 17 57 35 50 45 7 22 15 13 20 13 15 32 13 39 25 38 31 16 7...
 The data represent the age of world leaders on their day of inauguration Find the five-number summary, and construct a poxplot for the data. Comment on the shape 57 of the distribution ummary is0000 Choose the correct boxplot of the data below O B. Choose the correct description of the shape of the distribution OA· The distribution is skewed to the right O B. The distribution is roughly symmetric O c. The distribution is skewed to the lef O D....
 Sample Data Sample Data Hour Sample Taken Hour Sample Taken 1 4 5 X 1 3 1 42 2 3 4 5 6 2 39 36 25 60 28 53 22 56 41 34 43 45 59 42 36 40 45 39 48 26 42 34 61 48 45 29 3 31 61 38 40 54 26 38 42 37 41 53 37 47 41 37 29 20 26 43 38 33 37 37 35 33 36 41 25 37...
 The accounts manager of a large retail store is investigating the number of days that customers take to pay their invoices, the normal period being 30 days. An inspection of the payment records of 30 randomly- selected customers, revealed the following payment pattern. 35 42 34 27 32 30 24 33 27 36 30 38 26 32 28 28 39 23 17 20 31 29 30 24 25 29 31 30 19 34 1.1 Using 7 classes, each of width...
Most questions answered within 3 hours.
-
1. Why are the advantages and disadvantages of object-oriented
databases? 2. What are data marts? How...
asked 1 minute ago -
A Porsche challenges a Honda to a 4.00×10²m race. Because the
Porsche's acceleration of 3.30 m/s2...
asked 2 minutes ago -
A sample of C3H8 has 1.60×1024 H atoms.
How many carbon atoms does the sample contain?...
asked 55 minutes ago -
How many unique codes are possibly formed from two characters,
where the first character can be...
asked 24 minutes ago -
A concentration cell is built based on the reaction:
2H+ + 2e- ----> H2
The pH...
asked 20 minutes ago -
what is the ph of the following solutions?
150 g NH4CI dissolved into 10.0 mL of...
asked 32 minutes ago -
A projectile is launched with an initial speed of 40 m/s at an
angle of 25°...
asked 14 minutes ago -
1. Using a function, display the customer who has the highest
credit limit. Display the customer...
asked 23 minutes ago -
A spatially uniform electric field varies in time according
to E = Eo + 3000 t,...
asked 49 minutes ago -
An electric power station that operates at 25 kV and uses a 20:1
step-up ideal transformer...
asked 42 minutes ago -
1. If 0.02% of a 0.6 M weak acid ionizes in a solution, what is
the...
asked 28 minutes ago -
The College of Business at Northeast College is accumulating
data as a first step in the...
asked 34 minutes ago