Compare the different Genders of subjects in the Psych_Data.xlsx data set to determine if there is a statistically significant difference in the mean Anxiety Scores (anx_score) between the different gender groups. Be sure to state the type of test, state the Ho and Ha, include all relevant Excel results and plots, and write final conclusions for the full results of the test in context. Be sure that your final conclusions are written in common terms for an average person to understand.
(a) What type of hypothesis test will you run? MY ANSWER Independent samples T-Test for a significant difference in means.
(b) State the Ho and Ha. MY ANSWER, Ho: μ1= μ2 Ha: μ1 > μ2 where μ1= male anxiety and μ2= female anxiety OR/AND
Ho; there is no significant difference in the means of the two populations
Ha; There is a significant difference in the means of the two populations
HELP.>>>>>>(c) Include descriptive statistics (mean, standard deviation, sample size) AND an appropriate graphical display that allows you to visually compare the Anxiety Scores for the two gender groups. Copy/paste the numerical summaries and graph here AND describe the similarities and differences in the Anxiety Scores of the two groups (address central tendency and variation of the two groups in your discussion).
HELP>>>>(d) Give the test statistic, p-value, and decision from your test results.
HELP>>>>(e) Write a full conclusion (in context) for the results on this test in a way that can be understood by a non-statistical person.

Homework Answers
a)
since the two groups of males and females are independent of each
other, I use T-Test for Independent samples.
b)
Ho: there is no significant difference in the mean anxiety between
males and females. μ1=μ2
H1: there is a significant difference in the mean anxiety between
males and females. μ1=μ2 (two-tailed test)
where μ1= male anxiety and μ2= female anxiety
c)
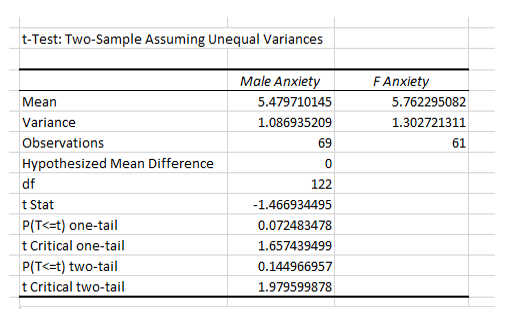
the mean anxiety score for males (M=5.47, SD= sqrt(1.08)) is same
as that of females (M=5.76, SD= sqrt(1.3027))

d)
t = -1.4669
p-value = 0.1449
With t=-1.4669, p>5%, I fail to reject the null hypothesis at 5% level of significance and conclude that there is no significant difference in the mean anxiety between males and females. μ1=μ2
e)
there is no sufficient evidence to support the claim that there is a significant difference in the mean anxiety between males and females.
Add Answer to:
Compare the different Genders of subjects in
the Psych_Data.xlsx data set to determine if there is...
Question 17 9 pts Consider a situation where we want to compare means, Mi and M2...
 Question 17 9 pts Consider a situation where we want to compare means, Mi and M2 of two populations, Group 1 and Group 2, respectively. A random sample of 40 observations was selected from each of the two populations. The following table shows the two-sample t test results at a = 5% assuming equal population variances: t-Test: Two-Sample Assuming Equal Variances Group 2 28.652 33.460 40 Mean Variance Observations Pooled Variance Hypothesized Mean Difference df t Stat P(T<=t) one-tail t...
Consider the accompanying data on plant growth after the application of different types of growth hormone....
Consider the accompanying data on plant growth after the application of different types of growth hormone. 1: 13 17 8 15 2: 21 12 20 17 3: 19 14 20 17 4: 8 11 18 9 5: 6 12 14 7 (a) Perform an F test at level α = 0.05. State the appropriate hypotheses. H0: μ1 = μ2 = μ3 = μ4 = μ5 Ha: all five μi's are unequal H0: μ1 = μ2 = μ3 = μ4 =...
Suppose you want to determine whether there is a significant difference in mean test scores for...
Suppose you want to determine whether there is a significant difference in mean test scores for females and males. The test is out of 600 points. Using the following hypotheses: Ho: U1 - U2 = 0 HA: U1 - U2 (not equal) 0 And alpha of 0.05 you obtain the following results t-test Two-sample assuming unequal variances Females Males Mean 525 487 Variance 3530.8 2677.818182 Observations 16 12 Hypothesized Mean Difference 0 df 25 t stat 1.803753 P (T<=t) one...
(1 point) In order to compare the means of two populations, independent random samples of 271...
 (1 point) In order to compare the means of two populations, independent random samples of 271 observations are selected from each population, with the following results: Sample 1 Sample 2 1145 2 120 (a) Use a 99 % confidence interval to estimate the difference between the population means (A-μ). (b) Test the null hypothesis: HO : (μί-12-0 versus the alternative hypothesis. Ha : (μ-μ2)メ (i) the test statistic z () the positive critical z score (ii) the negative critical z...
In the picture below, I have the output for the same two sets of data. I ran the hypothesis test and the confidence interval. If you had a choice to use one output or the other, which would you choose...
In the picture below, I have the output for the same two sets of data. I ran the hypothesis test and the confidence interval. If you had a choice to use one output or the other, which would you choose and why? Make sure to be specific and include what information you get from each and what information you don't get if you use one over the other. Options Two sample T summary hypothesis test: : Mean of Population 1...
To test whether the mean time needed to mix a batch of material is the same for machines produced by three manufacturers...
 To test whether the mean time needed to mix a batch of material
is the same for machines produced by three manufacturers, a
chemical company obtained the following data on the time (in
minutes) needed to mix the material.
Manufacturer
1
2
3
20
28
20
25
25
18
24
32
24
27
27
18
(a)
Use these data to test whether the population mean times for
mixing a batch of material differ for the three manufacturers.
Use
α =...
To test whether the mean time needed to mix a batch of material
is the same for machines produced by three manufacturers, a
chemical company obtained the following data on the time (in
minutes) needed to mix the material.
Manufacturer
1
2
3
20
28
20
25
25
18
24
32
24
27
27
18
(a)
Use these data to test whether the population mean times for
mixing a batch of material differ for the three manufacturers.
Use
α =...
The following data were obtained for a randomized block design involving five treatments and three blocks:...
The following data were obtained for a randomized block design involving five treatments and three blocks: SST = 490, SSTR = 310, SSBL = 95. Set up the ANOVA table. (Round your value for F to two decimal places, and your p-value to three decimal places.) Source of Variation Sum of Squares Degrees of Freedom Mean Square F p-value Treatments Blocks Error Total Test for any significant differences. Use α = 0.05. State the null and alternative hypotheses. H0: At...
a) State the null and alternative hypotheses. Which of the following is correct? A. H0: μ1=μ2;...
 a) State the null and alternative hypotheses. Which of the
following is correct?
A. H0: μ1=μ2; Ha: μ1<μ2 This is the correct answer.
B. H0: μ1=μ2; Ha: μ1≠μ2
C. H0: μ1=μ2; Ha: μ1>μ2
(b) Identify the P-value and state the researcher's
conclusion if the level of significance was
α=_____
What is the P-value?
P-value=____
State the researcher's conclusion. Which of the following is
correct?
A. Fail to reject H0,there is sufficient evidence to conclude
that the mean step pulse of...
a) State the null and alternative hypotheses. Which of the
following is correct?
A. H0: μ1=μ2; Ha: μ1<μ2 This is the correct answer.
B. H0: μ1=μ2; Ha: μ1≠μ2
C. H0: μ1=μ2; Ha: μ1>μ2
(b) Identify the P-value and state the researcher's
conclusion if the level of significance was
α=_____
What is the P-value?
P-value=____
State the researcher's conclusion. Which of the following is
correct?
A. Fail to reject H0,there is sufficient evidence to conclude
that the mean step pulse of...
The College Board provided comparisons of Scholastic Aptitude Test (SAT) scores based on the highest level...
The College Board provided comparisons of Scholastic Aptitude Test (SAT) scores based on the highest level of education attained by the test taker's parents. A research hypothesis was that students whose parents had attained a higher level of education would on average score higher on the SAT. The overall mean SAT math score was 514.† SAT math scores for independent samples of students follow. The first sample shows the SAT math test scores for students whose parents are college graduates...
Suppose we have taken independent, random samples of sizes n1 = 7 and n2 = 7...
Suppose we have taken independent, random samples of sizes n1 = 7 and n2 = 7 from two normally distributed populations having means μ1 and μ2, and suppose we obtain x1=240, x2=210, s1=5, and s2 = 6 Use critical values and p-values to test the null hypothesis H0: μ1 − μ2 ≤ 20 versus the alternative hypothesis Ha: μ1 − μ2 > 20 by setting α equal to .10. How much evidence is there that the difference between μ1 and...
 Question 17 9 pts Consider a situation where we want to compare means, Mi and M2 of two populations, Group 1 and Group 2, respectively. A random sample of 40 observations was selected from each of the two populations. The following table shows the two-sample t test results at a = 5% assuming equal population variances: t-Test: Two-Sample Assuming Equal Variances Group 2 28.652 33.460 40 Mean Variance Observations Pooled Variance Hypothesized Mean Difference df t Stat P(T<=t) one-tail t...
 (1 point) In order to compare the means of two populations, independent random samples of 271 observations are selected from each population, with the following results: Sample 1 Sample 2 1145 2 120 (a) Use a 99 % confidence interval to estimate the difference between the population means (A-μ). (b) Test the null hypothesis: HO : (μί-12-0 versus the alternative hypothesis. Ha : (μ-μ2)メ (i) the test statistic z () the positive critical z score (ii) the negative critical z...
 To test whether the mean time needed to mix a batch of material
is the same for machines produced by three manufacturers, a
chemical company obtained the following data on the time (in
minutes) needed to mix the material.
Manufacturer
1
2
3
20
28
20
25
25
18
24
32
24
27
27
18
(a)
Use these data to test whether the population mean times for
mixing a batch of material differ for the three manufacturers.
Use
α =...
To test whether the mean time needed to mix a batch of material
is the same for machines produced by three manufacturers, a
chemical company obtained the following data on the time (in
minutes) needed to mix the material.
Manufacturer
1
2
3
20
28
20
25
25
18
24
32
24
27
27
18
(a)
Use these data to test whether the population mean times for
mixing a batch of material differ for the three manufacturers.
Use
α =...
 a) State the null and alternative hypotheses. Which of the
following is correct?
A. H0: μ1=μ2; Ha: μ1<μ2 This is the correct answer.
B. H0: μ1=μ2; Ha: μ1≠μ2
C. H0: μ1=μ2; Ha: μ1>μ2
(b) Identify the P-value and state the researcher's
conclusion if the level of significance was
α=_____
What is the P-value?
P-value=____
State the researcher's conclusion. Which of the following is
correct?
A. Fail to reject H0,there is sufficient evidence to conclude
that the mean step pulse of...
a) State the null and alternative hypotheses. Which of the
following is correct?
A. H0: μ1=μ2; Ha: μ1<μ2 This is the correct answer.
B. H0: μ1=μ2; Ha: μ1≠μ2
C. H0: μ1=μ2; Ha: μ1>μ2
(b) Identify the P-value and state the researcher's
conclusion if the level of significance was
α=_____
What is the P-value?
P-value=____
State the researcher's conclusion. Which of the following is
correct?
A. Fail to reject H0,there is sufficient evidence to conclude
that the mean step pulse of...
Most questions answered within 3 hours.
-
A manufacturer of chocolate chips would like to know whether its
bag filling machine works correctly...
asked 4 minutes ago -
Consider the student registration business process at
your college:
1.)Describe the steps necessary for you to...
asked 10 minutes ago -
when released from rest at point A, an unknown ion moves to
point B. At point...
asked 2 minutes ago -
A stock is expected to pay the following dividends: $1.1
four years from now, $1.4 five...
asked 8 minutes ago -
G=yellow and g=green pea seeds. You cross a heterozygous
yellow-seeded plant with a green-seeded plant to...
asked 10 minutes ago -
Current Balance Experiment
a) When there is no current flowing through the electromagnet
coil, is there...
asked 9 minutes ago -
In Visual Basic 2017, Write a complete Main method that prints
Hello, world to the screen....
asked 26 minutes ago -
a) Find the pressure difference on an airplane wing if air flows
over the upper surface...
asked 32 minutes ago -
Write an assessment of the current business analysis of Hilton
Worldwide using Porters 5 Forces analysis.
asked 42 minutes ago -
i need help on this
Chapter 9 Section 3 Question 1:
Rudy puts this poster, with...
asked 51 minutes ago -
True or false Assembly x86
41. _____ The program counter is a pointer to the
instruction....
asked 52 minutes ago -
You have conducted an experiment to try to demonstrate that
growth factor receptor X protein (GFRX)...
asked 1 hour ago