
Homework Answers
Add Answer to:
Find the indicated z score. The graph depicts the standard normal distribution with mean 0 and...
Find the indicated score. The graph depicts the standard normal distribution with mean and standard deviation...
 Find the indicated score. The graph depicts the standard normal distribution with mean and standard deviation 1 Click to view page 1o the table Click to view page of the The indicated z score is Round to two decimal places as needed Find the area of the shaded region. The graph to the right depicts I scores of adults and those scores we normally distributed with a mean of 100 and a standard deviation of 15 Click to view.age 1...
Find the indicated z score. The graph depicts the standard normal distribution with mean 0 and...
Find the indicated z score. The graph depicts the standard normal distribution with mean 0 and standard deviation 1. z 0.8438 A graph with a bell-shaped curve, divided into 2 regions by a line from top to bottom on the right side. The region left of the line is shaded and is labeled 0.8438. The indicated z score is (Round to two decimal places as needed.)
Find the indicated z score. The graph depicts the standard normal distribution with mean 0 and...
 Find the indicated z score. The graph depicts the standard normal distribution with mean 0 and standard deviation 1 C 0.2206 z 0 The indicated z score is (Round to two decimal places as needed.) Enter your answer in the answer box Find the indicated z score. The graph depicts the standard normal distribution with mean 0 and standard deviation 1. 0.7517 z 0 The indicated z score isa (Round to two decimal places as needed.) Enter vour answer in...
Find the indicated z score. The graph depicts the standard normal distribution with mean 0 and...
 Find the indicated z score. The graph depicts the standard normal distribution with mean 0 and standard deviation 1 0.2877 The indicated z score is (Round to two decimal places as needed.)
Find the indicated z,score. The graph depicts the standard normal distribution with mean 0 and standard...
 Find the indicated z,score. The graph depicts the standard normal distribution with mean 0 and standard deviation 1 0.1562 The indicated z score is □ (Round to two decimal places as needed.)
Find the indicated z score. The graph depicts the standard normal distribution with mean 0 and...
 Find the indicated z score. The graph depicts the standard normal distribution with mean 0 and standard deviation 1 0.2877 1 ZO The indicated z score is (Round to two decimal places as needed)
find the indicated z score. the graph depicts the standard normal distrubution with mean 0 and...
 find the indicated z score. the graph depicts the standard normal
distrubution with mean 0 and standard deviation 1.
# on graph is: 0.9875
EQuestion Help Find the indicated z score. The graph depicts the standard nomal distribution with mean 0 and standard deviation 1 Click to view page1 of the table. Click to view page 2 of the lable The indicated z score isi (Round to two decimal places as needed)
find the indicated z score. the graph depicts the standard normal
distrubution with mean 0 and standard deviation 1.
# on graph is: 0.9875
EQuestion Help Find the indicated z score. The graph depicts the standard nomal distribution with mean 0 and standard deviation 1 Click to view page1 of the table. Click to view page 2 of the lable The indicated z score isi (Round to two decimal places as needed)
Find the indicated z score. The graph depicts the standard normal distribution with mean 0 and...
 Find the indicated z score. The graph depicts the standard normal distribution with mean 0 and standard deviation 1. 13) Shaded area is 0.9599. A) - 1.38 B) 1.03 1.82 D) 1.75 14) Shaded area is 0.0694. A) 1.45 B) 1.26 1.48 D) 1.39Find the indicated value. 15) z0.005 A) 2.535 D) 2.015 92.835 B) 2.575 16) z0.36 A) 1.76 B) 0.45 1.60 D) 0.36 Provide an appropriate response. 17) Find the area of the shaded region. The graph depicts IQ scores of adults, and those scores are normally distributed...
Find the indicated z score. The graph depicts the standard normal distribution with mean 0 and...
Find the indicated z score. The graph depicts the standard normal distribution with mean 0 and standard deviation 1. A symmetric bell-shaped curve is plotted over a horizontal scale with two labeled coordinates. One coordinate is labeled "0" and is located at the center and peak of the curve. The other coordinate is labeled "z," and is to the left of 0. A vertical line extends from the scale to the curve at z. The area under the curve to...
3. Find the area of the shaded region. The graph depicts the standard normal distribution (1...
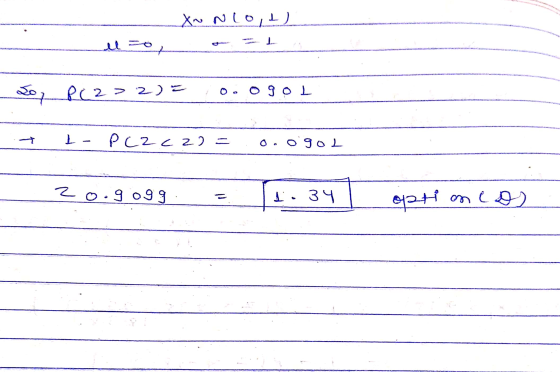
 3. Find the area of the shaded region. The graph depicts the standard normal distribution (1 point) with mean 0 and standard deviation 1. -2.341.17 117 234 z 0.1210 0.7580 0.8790 0.2420 0 4. Find the indicated z score. The graph depicts the standard normal distribution with(1 point) mean 0 and standard deviation 1 Shaded area is 0.0901
 Find the indicated score. The graph depicts the standard normal distribution with mean and standard deviation 1 Click to view page 1o the table Click to view page of the The indicated z score is Round to two decimal places as needed Find the area of the shaded region. The graph to the right depicts I scores of adults and those scores we normally distributed with a mean of 100 and a standard deviation of 15 Click to view.age 1...
 Find the indicated z score. The graph depicts the standard normal distribution with mean 0 and standard deviation 1 C 0.2206 z 0 The indicated z score is (Round to two decimal places as needed.) Enter your answer in the answer box Find the indicated z score. The graph depicts the standard normal distribution with mean 0 and standard deviation 1. 0.7517 z 0 The indicated z score isa (Round to two decimal places as needed.) Enter vour answer in...
 Find the indicated z score. The graph depicts the standard normal distribution with mean 0 and standard deviation 1 0.2877 The indicated z score is (Round to two decimal places as needed.)
 Find the indicated z,score. The graph depicts the standard normal distribution with mean 0 and standard deviation 1 0.1562 The indicated z score is □ (Round to two decimal places as needed.)
 Find the indicated z score. The graph depicts the standard normal distribution with mean 0 and standard deviation 1 0.2877 1 ZO The indicated z score is (Round to two decimal places as needed)
 find the indicated z score. the graph depicts the standard normal
distrubution with mean 0 and standard deviation 1.
# on graph is: 0.9875
EQuestion Help Find the indicated z score. The graph depicts the standard nomal distribution with mean 0 and standard deviation 1 Click to view page1 of the table. Click to view page 2 of the lable The indicated z score isi (Round to two decimal places as needed)
find the indicated z score. the graph depicts the standard normal
distrubution with mean 0 and standard deviation 1.
# on graph is: 0.9875
EQuestion Help Find the indicated z score. The graph depicts the standard nomal distribution with mean 0 and standard deviation 1 Click to view page1 of the table. Click to view page 2 of the lable The indicated z score isi (Round to two decimal places as needed)
 3. Find the area of the shaded region. The graph depicts the standard normal distribution (1 point) with mean 0 and standard deviation 1. -2.341.17 117 234 z 0.1210 0.7580 0.8790 0.2420 0 4. Find the indicated z score. The graph depicts the standard normal distribution with(1 point) mean 0 and standard deviation 1 Shaded area is 0.0901
Most questions answered within 3 hours.
-
A large cable company reports the following.
80% of its customers subscribe to its cable TV...
asked 12 minutes ago -
Please answer the question in brief.
Discuss the role of ERP in organizations. Are ERP tools...
asked 1 minute from now -
Discuss the pros and cons of collaborative software such
as SameTime. Does it increase productivity? What...
asked 11 minutes ago -
1. Are all good samples random?
2. Magazines often report surveys giving statistics such as “63%...
asked 6 minutes ago -
Buying your in-laws a gift because it’s expected is
due to the ____________ motive of gift-giving....
asked 14 minutes ago -
Calculate the expected value, the variance, and the standard
deviation of the given random variable X....
asked 57 minutes ago -
A hospital performs 100 surgeries per week. The probability that
complications after surgery occur is 10%....
asked 1 hour ago -
1 point) Given the significance level α=0.01 find the following:
(a) left-tailed z value z= (b)...
asked 55 minutes ago -
Assuming you are the head of the software development unit at
Cyber.Soft, explain and justify why...
asked 21 minutes ago -
Magnesium and nitrogen react in a combination reaction to
produce magnesium nitride. 3 Mg + N2...
asked 29 minutes ago -
Two electrons are initially at rest separated by a distance of
2nm. At time t=0, they...
asked 27 minutes ago -
A martial artist is practicing breaking 5 boards. He is able to
break aboard with probability...
asked 34 minutes ago