Not all bivariate relationships are linear. When you plot a scatterplot, sometimes you observe a curved...
Not all bivariate relationships are linear. When you plot a scatterplot, sometimes you observe a curved relationship. In those cases, we can apply a transformation to the data that will make the relationship approximately linear. [We generally prefer simpler models. And linear regression models are simpler than curved regression models. Also, transforming data is common in statistical practice.] One of the most common transformation methods is the log transformation.
In this problem, you apply the log transformation to both variables in the data for the previous problem to experiment the model fitness. Create another variable 'lnCost' by taking the natural log of cost. Do the same for the length of stay (los), and create another variable 'lnLos'. Then obtain the least squares regression line for 'lnCost' as a function of 'lnLos', and graph the line on the scatterplot.
Does a linear regression line seem to fit these transformed variables? Better than the one without transformation? Explain.
Create the residual plot of this plot in the same way as the previous problem. How are the residuals different from the previous problem?
Create the normal plot of the residuals. How is this plot different from the one from the previous problem?
In your opinion, is the linear regression model made from the transformed variables a better model? Explain in detail.
|
cost |
los |
|
13728 |
13 |
|
8062 |
8 |
|
4805 |
13 |
|
5099 |
6 |
|
14963 |
33 |
|
4295 |
2 |
|
4046 |
9 |
|
3193 |
13 |
|
15486 |
16 |
|
9413 |
11 |
|
9034 |
19 |
|
8939 |
20 |
|
17596 |
26 |
|
1884 |
3 |
|
1763 |
5 |
|
1233 |
1 |
|
6286 |
30 |
|
2849 |
4 |
|
2818 |
4 |
|
2265 |
2 |
|
1652 |
9 |
|
1846 |
4 |
|
25460 |
18 |
|
4570 |
16 |
|
12213 |
10 |
|
5870 |
12 |
|
24484 |
52 |
|
4735 |
19 |
|
13334 |
9 |
|
35381 |
85 |
|
5681 |
8 |
|
7161 |
20 |
|
10592 |
41 |
Homework Answers

This image contain original and log transformed observations.
 The
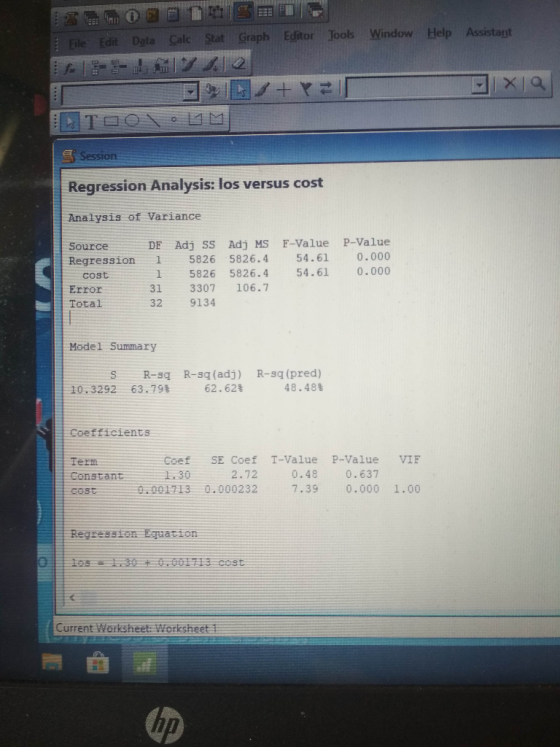
above two images contain linear reg model of lost  and cost
The
above two images contain linear reg model of lost  and cost
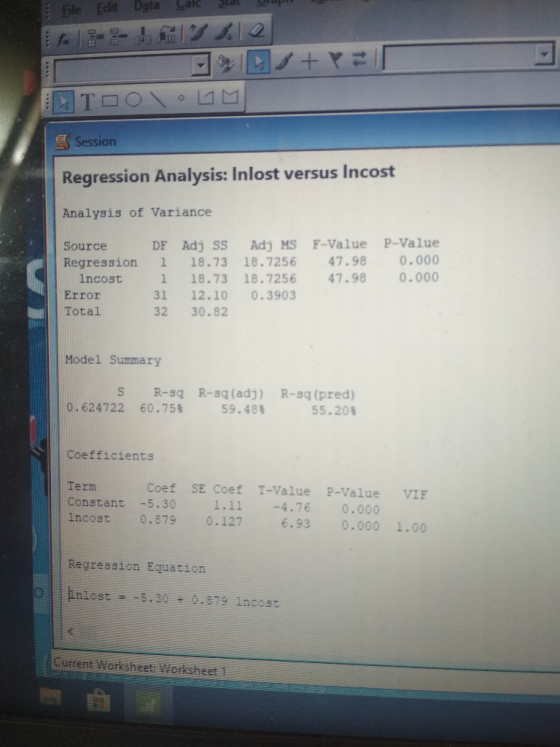
 This
above two images containa reg model of transformed variables.
This
above two images containa reg model of transformed variables.
In this both models the variation explained by independent variable(R square value) is almost same. Because the data is already normally distributed but the error in transformed model is very less as compared to original model. So we can say that transformed model is good.
The residual plot of original variable looks like little bit of outward funnel where as the residual plot of transformed variables is shows constant variance which satisfied the assumption of homoscedasticity.
Both the model data is normally distributed. Histogram of transformed observation little bit streched at middle.
Yes, transformed model is good because as compared to original model it gives very less error.
I have one note for this topic- Mostly transformation works good when the difference bet dependent and independent variable are sufficiently large otherwise it gives almost same results.
If it is right please like this
Thank You
Add Answer to:
Not all bivariate relationships are linear. When you plot a
scatterplot, sometimes you observe a curved...
When you use linear regression to fit a linear model, and create a scatterplot of actual...
 When you use linear regression to fit a linear model, and create a scatterplot of actual vs. predicted values, you would ideally see: a. the points lie close to the diagonal line from bottom left to upper right b. the points form a random "cloud" C. the point lie close to a horizontal line (write a, b or c): (True/False) If you have many variables (features), you will tend to prefer non-parametric methods to parametric methods. The two plots below...
Need help with stats true or false questions Decide (with short explanations) whether the following statements are true or false a) We consider the model y-Ao +A(z) +E. Let (-0.01, 1.5) be a 95% con...
 Need help with stats true or false questions
Decide (with short explanations) whether the following statements are true or false a) We consider the model y-Ao +A(z) +E. Let (-0.01, 1.5) be a 95% confidence interval for A In this case, a t-test with significance level 1% rejects the null hypothesis Ho : A-0 against a two sided alternative. b) Complicated models with a lot of parameters are better for prediction then simple models with just a few parameters c)...
Need help with stats true or false questions
Decide (with short explanations) whether the following statements are true or false a) We consider the model y-Ao +A(z) +E. Let (-0.01, 1.5) be a 95% confidence interval for A In this case, a t-test with significance level 1% rejects the null hypothesis Ho : A-0 against a two sided alternative. b) Complicated models with a lot of parameters are better for prediction then simple models with just a few parameters c)...
PLEASE ANSWER ALL parts . IF YOU CANT ANSWER ALL, KINDLY ANSWER PART (E) AND PART(F)...
 PLEASE ANSWER ALL parts .
IF YOU CANT ANSWER ALL, KINDLY ANSWER PART (E) AND
PART(F)
FOR PART (E) THE REGRESSION MODEL IS ALSO GIVE AT THE
END.
REGRESSION MODEL:
We will be returning to the mtcars dataset, last seen in assignment 4. The dataset mtcars is built into R. It was extracted from the 1974 Motor Trend US magazine, and comcaprises fuel consumption and 10 aspects of automobile design and performance for 32 automobiles (1973-74 models). You can find...
PLEASE ANSWER ALL parts .
IF YOU CANT ANSWER ALL, KINDLY ANSWER PART (E) AND
PART(F)
FOR PART (E) THE REGRESSION MODEL IS ALSO GIVE AT THE
END.
REGRESSION MODEL:
We will be returning to the mtcars dataset, last seen in assignment 4. The dataset mtcars is built into R. It was extracted from the 1974 Motor Trend US magazine, and comcaprises fuel consumption and 10 aspects of automobile design and performance for 32 automobiles (1973-74 models). You can find...
For expert using R , I solve it but i need to figure out what I...
 For expert using R , I solve it but i need to figure out what
I got is correct or wrong. Thank you
# Simple Linear Regression and Polynomial Regression
# HW 2
#
# Read data from csv file
data <-
read.csv("C:\data\SweetPotatoFirmness.csv",header=TRUE,
sep=",")
head(data)
str(data)
# scatterplot of independent and dependent variables
plot(data$pectin,data$firmness,xlab="Pectin,
%",ylab="Firmness")
par(mfrow = c(2, 2)) # Split the plotting panel into a 2 x 2
grid
model <- lm(firmness ~ pectin , data=data)
summary(model)
anova(model)
plot(model)...
For expert using R , I solve it but i need to figure out what
I got is correct or wrong. Thank you
# Simple Linear Regression and Polynomial Regression
# HW 2
#
# Read data from csv file
data <-
read.csv("C:\data\SweetPotatoFirmness.csv",header=TRUE,
sep=",")
head(data)
str(data)
# scatterplot of independent and dependent variables
plot(data$pectin,data$firmness,xlab="Pectin,
%",ylab="Firmness")
par(mfrow = c(2, 2)) # Split the plotting panel into a 2 x 2
grid
model <- lm(firmness ~ pectin , data=data)
summary(model)
anova(model)
plot(model)...
1. For each of the following regression models, write down the X matrix and 3 vector....
 1. For each of the following regression models, write down the X matrix and 3 vector. Assume in both cases that there are four observations (a) Y BoB1X1 + B2X1X2 (b) log Y Bo B1XiB2X2+ 2. For each of the following regression models, write down the X matrix and vector. Assume in both cases that there are five observations. (a) YB1XB2X2+BXE (b) VYBoB, X,a +2 log10 X2+E regression model never reduces R2, why 3. If adding predictor variables to a...
Question 1 Which of the following choices best describes the scatterplot shown below? Group of answer...
Question 1 Which of the following choices best describes the scatterplot shown below? Group of answer choices Linear, negative, strong No form, weak Linear, positive, strong Curved, weak Question 2 Which of the following choices is most likely to be the correlation of the data in the scatterplot shown below? Group of answer choices -0.14 1.04 0.86 -0.92 Question 3 Most roller coasters get their speed by dropping down a steep initial incline, so it makes sense that we can...
A group of physics students collected data from a test of the projectile motion problem that...
 A group of physics students collected data from a test of the projectile motion problem that was analyzed in a previous lab exercise (L5). In their test, the students varied the angle and initial velocity Vo at which the projectile was launched, and then measured the resulting time of flight (tright). Note that tright was the dependent variable, while and Vo were independent variables. The results are listed below. (degrees) Time of Flight (s) Initial Velocity V. (m/s) 15 20...
All of the following questions are in relation to the following journal article which is available...
 All of the following questions are in relation to the following journal article which is available on Moodle: Parr CL, Magnus MC, Karlstad O, Holvik K, Lund-Blix NA, Jaugen M, et al. Vitamin A and D intake in pregnancy, infant supplementation and asthma development: the Norwegian Mother and Child Cohort. Am J Clin Nutr 2018:107:789-798 QUESTIONS: 1. State one hypothesis the author's proposed in the manuscript. 2. There is previous research that shows that adequate Vitamin A intake is required...
 When you use linear regression to fit a linear model, and create a scatterplot of actual vs. predicted values, you would ideally see: a. the points lie close to the diagonal line from bottom left to upper right b. the points form a random "cloud" C. the point lie close to a horizontal line (write a, b or c): (True/False) If you have many variables (features), you will tend to prefer non-parametric methods to parametric methods. The two plots below...
 Need help with stats true or false questions
Decide (with short explanations) whether the following statements are true or false a) We consider the model y-Ao +A(z) +E. Let (-0.01, 1.5) be a 95% confidence interval for A In this case, a t-test with significance level 1% rejects the null hypothesis Ho : A-0 against a two sided alternative. b) Complicated models with a lot of parameters are better for prediction then simple models with just a few parameters c)...
Need help with stats true or false questions
Decide (with short explanations) whether the following statements are true or false a) We consider the model y-Ao +A(z) +E. Let (-0.01, 1.5) be a 95% confidence interval for A In this case, a t-test with significance level 1% rejects the null hypothesis Ho : A-0 against a two sided alternative. b) Complicated models with a lot of parameters are better for prediction then simple models with just a few parameters c)...
 PLEASE ANSWER ALL parts .
IF YOU CANT ANSWER ALL, KINDLY ANSWER PART (E) AND
PART(F)
FOR PART (E) THE REGRESSION MODEL IS ALSO GIVE AT THE
END.
REGRESSION MODEL:
We will be returning to the mtcars dataset, last seen in assignment 4. The dataset mtcars is built into R. It was extracted from the 1974 Motor Trend US magazine, and comcaprises fuel consumption and 10 aspects of automobile design and performance for 32 automobiles (1973-74 models). You can find...
PLEASE ANSWER ALL parts .
IF YOU CANT ANSWER ALL, KINDLY ANSWER PART (E) AND
PART(F)
FOR PART (E) THE REGRESSION MODEL IS ALSO GIVE AT THE
END.
REGRESSION MODEL:
We will be returning to the mtcars dataset, last seen in assignment 4. The dataset mtcars is built into R. It was extracted from the 1974 Motor Trend US magazine, and comcaprises fuel consumption and 10 aspects of automobile design and performance for 32 automobiles (1973-74 models). You can find...
 For expert using R , I solve it but i need to figure out what
I got is correct or wrong. Thank you
# Simple Linear Regression and Polynomial Regression
# HW 2
#
# Read data from csv file
data <-
read.csv("C:\data\SweetPotatoFirmness.csv",header=TRUE,
sep=",")
head(data)
str(data)
# scatterplot of independent and dependent variables
plot(data$pectin,data$firmness,xlab="Pectin,
%",ylab="Firmness")
par(mfrow = c(2, 2)) # Split the plotting panel into a 2 x 2
grid
model <- lm(firmness ~ pectin , data=data)
summary(model)
anova(model)
plot(model)...
For expert using R , I solve it but i need to figure out what
I got is correct or wrong. Thank you
# Simple Linear Regression and Polynomial Regression
# HW 2
#
# Read data from csv file
data <-
read.csv("C:\data\SweetPotatoFirmness.csv",header=TRUE,
sep=",")
head(data)
str(data)
# scatterplot of independent and dependent variables
plot(data$pectin,data$firmness,xlab="Pectin,
%",ylab="Firmness")
par(mfrow = c(2, 2)) # Split the plotting panel into a 2 x 2
grid
model <- lm(firmness ~ pectin , data=data)
summary(model)
anova(model)
plot(model)...
 1. For each of the following regression models, write down the X matrix and 3 vector. Assume in both cases that there are four observations (a) Y BoB1X1 + B2X1X2 (b) log Y Bo B1XiB2X2+ 2. For each of the following regression models, write down the X matrix and vector. Assume in both cases that there are five observations. (a) YB1XB2X2+BXE (b) VYBoB, X,a +2 log10 X2+E regression model never reduces R2, why 3. If adding predictor variables to a...
 A group of physics students collected data from a test of the projectile motion problem that was analyzed in a previous lab exercise (L5). In their test, the students varied the angle and initial velocity Vo at which the projectile was launched, and then measured the resulting time of flight (tright). Note that tright was the dependent variable, while and Vo were independent variables. The results are listed below. (degrees) Time of Flight (s) Initial Velocity V. (m/s) 15 20...
 All of the following questions are in relation to the following journal article which is available on Moodle: Parr CL, Magnus MC, Karlstad O, Holvik K, Lund-Blix NA, Jaugen M, et al. Vitamin A and D intake in pregnancy, infant supplementation and asthma development: the Norwegian Mother and Child Cohort. Am J Clin Nutr 2018:107:789-798 QUESTIONS: 1. State one hypothesis the author's proposed in the manuscript. 2. There is previous research that shows that adequate Vitamin A intake is required...
Most questions answered within 3 hours.
-
Suppose a brewery has a filling machine that fills 12-ounce
bottles of beer. It is known...
asked 1 hour ago -
For this problem, carry at least four digits after the decimal
in your calculations. Answers may...
asked 4 hours ago -
Ask a user for three positive integer numbers. Use an input
validation loop to make sure...
asked 4 hours ago -
The most primitive form of data from data analysis perspective
is a. nominal scale b. ordinal...
asked 4 hours ago -
The number of vacancies in some hypothetical metal increases by
a factor of 5 when the...
asked 4 hours ago -
The fiduciary duty that is predicated on the concept that a
board of directors and officers...
asked 4 hours ago -
Sustainable Growth Rate Last year Umbrellas Unlimited
Corporation had an ROE of 17.3% and a dividend...
asked 4 hours ago -
Write a MATLAB program to do the following:
Receive 5 input values and store them into...
asked 4 hours ago -
Which one of the following aqueous solutions would you expect to
have the largest conductance: (a)...
asked 4 hours ago -
(Intermediate Macroeconomics)
2.The aggregate supply function be ys=2000+P, and the aggregate
demand function be yD=2400-P。Find the...
asked 4 hours ago -
I am having a really difficult time developing a strong thesis
for this question....... To what...
asked 5 hours ago -
There are n street lights in a line. In order to conserve
energy, the city decides...
asked 5 hours ago