2. Measuring stand alone risk using realized data

Homework Answers
Average Return = [0.1750 + 0.1190 + 0.2100 + 0.2940 + 0.0910] /
5
Average Return = 0.8890 / 5
Average Return = 0.1778 or 17.78%
Variance = [(0.1750 - 0.1778)^2 + (0.1190 - 0.1778)^2 + (0.2100
- 0.1778)^2 + (0.2940 - 0.1778)^2 + (0.0910 - 0.1778)^2] / 4
Variance = 0.0255388 / 4
Variance = 0.0063847
Standard Deviation = (0.0063847)^(1/2)
Standard Deviation = 0.0799 or 7.99%
Coefficient of Variation = Standard Deviation / Average
Return
Coefficient of Variation = 0.0799 / 0.1778
Coefficient of Variation = 0.45
Given the preceding data, the average realized return on CCC’s
stock is 17.78%.
The preceding data series represents a sample of CCC’s historical
returns. Based on this conclusion, the standard deviation of CCC’s
historical returns is 7.99%
If investors expect the average realized returns from 2012 to 2016
on CCC’s stock to continue into the future, its coefficient of
variation (CV) will be 0.45.
Add Answer to:
2. Measuring stand alone risk using realized data
2. Measuring standalone risk using realized data Aa...
2. Measuring standalone risk using realized data Aa Aa E Returns earned over a given time...
 2. Measuring standalone risk using realized data Aa Aa E Returns earned over a given time period are called realized returns. Historical data on realized returns is often used to estimate future results. Analysts across companies use realized stock returns to estimate the risk of a stock. Consider the case of Celestial Crane Cosmetics Inc. (CCC): Five years of realized returns for CCC are given in the following table. Remember: 1. While CCC was started 40 years ago, its common...
1. Measuring stand-alone risk using realized (historical) data Returns earned over a given time Analysts across...
 1. Measuring stand-alone risk using realized (historical) data Returns earned over a given time Analysts across companies alled returns. Historical data on realized returns is often used to estimate future results. estimate the risk of a stock. Consider the case of Celestial Five years of realized returns llowing table. Remember: has been publicly traded for the past 25 years. 3. The 2014 17.50% Stock return Given the preceding data, the average CCC's stocks of CCC's historical returns. Based on this...
2. Measuring standalone risk using realized (historical) data Aa Aa Returns earned over a given time...
 2. Measuring standalone risk using realized (historical) data Aa Aa Returns earned over a given time period are called realized returns. Historical data on realized returns is often used to estimate future results. Analysts across companies use realized stock returns to estimate the risk of a stock. Consider the case of Falcon Freight Inc. (FF): Five years of realized returns for FF are given in the following table. Remember: 1. While FF was started 40 years ago, its common stock...
3. Measuring standalone risk using realized (historical) data Aa Aa E Returns eamed over a given...
 3. Measuring standalone risk using realized (historical) data Aa Aa E Returns eamed over a given time period are called realized retums. Historical data on realized returns is often used to estimate future results. Analysts across companies use realized stock returns to estimate the risk of a stock. Consider the case of Falcon Freight Inc. (FF): Five years of realized returns for FF are given in the following table. Remember: 1. While FF was started 40 years ago, its common...
Assignment 08 - Risk and Rates of Return Five years of realized returns for CCC are...
 Assignment 08 - Risk and Rates of Return Five years of realized returns for CCC are given in the following table. Remember: 1. While CCC was started 40 years ago, its common stock has been publicly traded for the past 25 years. 2. The returns on its equity are calculated as arithmetic returns. 3. The historical returns for CCC for 2012 to 2015 are: 2012 17.50% 2013 11.90% 2014 21.00% 2015 29.40% 2016 9.10% Stock return Given the preceding data,...
2. Measuring standalone risk using realized data Aа Aa Returns earned over a given time period are called realized retu...
 2. Measuring standalone risk using realized data Aа Aa Returns earned over a given time period are called realized returns. Historical data on realized returns is often used to estimate future results. Analysts across companies use realized stock returns to estimate the risk of a stock Consider the case of Blue Llama Mining Inc. (BLM): Five years of realized returns for BLM are given in the following table. Remember: 1. While BLM was started 40 years ago, its common stock...
Consider the case of Celestial Crane Cosmetics Inc. (CCC): Five years of realized returns for CCC are given in the foll...
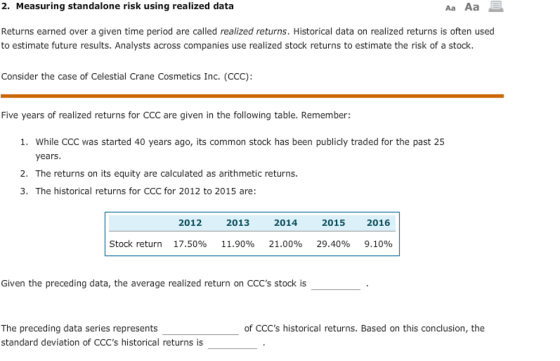
 Consider the case of Celestial Crane Cosmetics Inc. (CCC): Five years of realized returns for CCC are given in the following table. Remember: 1. While CCC was started 40 years ago, its common stock has been publicly traded for the past 25 years. 2. The returns on its equity are calculated as arithmetic returns. 3. The historical returns for CCC for 2012 to 2016 are: 2012 17.50% 2013 11.90% 2014 21.00% 2015 29.40% 2016 9.10% Stock return Given the preceding...
3. Measuring standalone risk using realized (historical) data Returns earned over a given time period are...
 3. Measuring standalone risk using realized (historical) data Returns earned over a given time period are called realized returns. Historical data on realized returns is often used to estimate future results. Analysts across companies use realized stock returns to estimate the risk of a stock. Consider the case of Blue Llama Mining Inc. (BLM): Five years of realized returns for BLM are given in the following table. Remember: 1. While BLM was started 40 years ago, its common stock has...
The scroll down option for the second question is population/universe/sample 4. Measuring standalone risk using realized...
 The scroll down option for the second question is
population/universe/sample
4. Measuring standalone risk using realized data Returns earned over a given time period are called realized returns. Historical data on realized returns is often used to estimate future results. Analysts across companies use realized stock returns to estimate the risk of a stock. Consider the case of Blue Llama Mining Inc. (BLM): Five years of realized returns for BLM are given in the following table. Remember: 1. While BLM...
The scroll down option for the second question is
population/universe/sample
4. Measuring standalone risk using realized data Returns earned over a given time period are called realized returns. Historical data on realized returns is often used to estimate future results. Analysts across companies use realized stock returns to estimate the risk of a stock. Consider the case of Blue Llama Mining Inc. (BLM): Five years of realized returns for BLM are given in the following table. Remember: 1. While BLM...
 2. Measuring standalone risk using realized data Aa Aa E Returns earned over a given time period are called realized returns. Historical data on realized returns is often used to estimate future results. Analysts across companies use realized stock returns to estimate the risk of a stock. Consider the case of Celestial Crane Cosmetics Inc. (CCC): Five years of realized returns for CCC are given in the following table. Remember: 1. While CCC was started 40 years ago, its common...
 1. Measuring stand-alone risk using realized (historical) data Returns earned over a given time Analysts across companies alled returns. Historical data on realized returns is often used to estimate future results. estimate the risk of a stock. Consider the case of Celestial Five years of realized returns llowing table. Remember: has been publicly traded for the past 25 years. 3. The 2014 17.50% Stock return Given the preceding data, the average CCC's stocks of CCC's historical returns. Based on this...
 2. Measuring standalone risk using realized (historical) data Aa Aa Returns earned over a given time period are called realized returns. Historical data on realized returns is often used to estimate future results. Analysts across companies use realized stock returns to estimate the risk of a stock. Consider the case of Falcon Freight Inc. (FF): Five years of realized returns for FF are given in the following table. Remember: 1. While FF was started 40 years ago, its common stock...
 2. Measuring standalone risk using realized (historical) data Aa Aa Returns earned over a given time period are called realized returns. Historical data on realized returns is often used to estimate future results. Analysts across companies use realized stock returns to estimate the risk of a stock. Consider the case of Falcon Freight Inc. (FF): Five years of realized returns for FF are given in the following table. Remember: 1. While FF was started 40 years ago, its common stock...
 3. Measuring standalone risk using realized (historical) data Aa Aa E Returns eamed over a given time period are called realized retums. Historical data on realized returns is often used to estimate future results. Analysts across companies use realized stock returns to estimate the risk of a stock. Consider the case of Falcon Freight Inc. (FF): Five years of realized returns for FF are given in the following table. Remember: 1. While FF was started 40 years ago, its common...
 Assignment 08 - Risk and Rates of Return Five years of realized returns for CCC are given in the following table. Remember: 1. While CCC was started 40 years ago, its common stock has been publicly traded for the past 25 years. 2. The returns on its equity are calculated as arithmetic returns. 3. The historical returns for CCC for 2012 to 2015 are: 2012 17.50% 2013 11.90% 2014 21.00% 2015 29.40% 2016 9.10% Stock return Given the preceding data,...
 2. Measuring standalone risk using realized data Aа Aa Returns earned over a given time period are called realized returns. Historical data on realized returns is often used to estimate future results. Analysts across companies use realized stock returns to estimate the risk of a stock Consider the case of Blue Llama Mining Inc. (BLM): Five years of realized returns for BLM are given in the following table. Remember: 1. While BLM was started 40 years ago, its common stock...
 Consider the case of Celestial Crane Cosmetics Inc. (CCC): Five years of realized returns for CCC are given in the following table. Remember: 1. While CCC was started 40 years ago, its common stock has been publicly traded for the past 25 years. 2. The returns on its equity are calculated as arithmetic returns. 3. The historical returns for CCC for 2012 to 2016 are: 2012 17.50% 2013 11.90% 2014 21.00% 2015 29.40% 2016 9.10% Stock return Given the preceding...
 3. Measuring standalone risk using realized (historical) data Returns earned over a given time period are called realized returns. Historical data on realized returns is often used to estimate future results. Analysts across companies use realized stock returns to estimate the risk of a stock. Consider the case of Blue Llama Mining Inc. (BLM): Five years of realized returns for BLM are given in the following table. Remember: 1. While BLM was started 40 years ago, its common stock has...
 The scroll down option for the second question is
population/universe/sample
4. Measuring standalone risk using realized data Returns earned over a given time period are called realized returns. Historical data on realized returns is often used to estimate future results. Analysts across companies use realized stock returns to estimate the risk of a stock. Consider the case of Blue Llama Mining Inc. (BLM): Five years of realized returns for BLM are given in the following table. Remember: 1. While BLM...
The scroll down option for the second question is
population/universe/sample
4. Measuring standalone risk using realized data Returns earned over a given time period are called realized returns. Historical data on realized returns is often used to estimate future results. Analysts across companies use realized stock returns to estimate the risk of a stock. Consider the case of Blue Llama Mining Inc. (BLM): Five years of realized returns for BLM are given in the following table. Remember: 1. While BLM...
Most questions answered within 3 hours.
-
lease solve all the
questions, don't need to explanations
Q1 - All animal
species have general...
asked 1 hour ago -
Business Phasing
1.Discuss the logical progression for growing a business, which
starts from the initial idea...
asked 1 hour ago -
Modify
When executing on the command line having only
this program name, the program will accept...
asked 2 hours ago -
Kenny Electric Company's noncallable bonds were issued several
years ago and now have 20 years to...
asked 3 hours ago -
find H(e^Jtheta) at theta= 0, pi/10, pi/20, pi/2 for
the following:
a) H(e^Jtheta)= 1+e^Jtheta
b) H(e^Jtheta)=...
asked 3 hours ago -
Home Corporation will open a new store on January 1. Based on
experience from its other...
asked 3 hours ago -
In a neoclassical model, use the IS-LM to analyze the effect of
a permanent money supply...
asked 4 hours ago -
An electron passes through a point 2.67 cm from a long straight
wire as it moves...
asked 5 hours ago -
A grammar is a 4-tuple G, G = (Ν, Σ, Π, Σ, S) where, Ν is...
asked 5 hours ago -
In this part, calculate the present values. Use the Excel PV
function to compute the present...
asked 5 hours ago -
Part 1. Primitive Types, Sorting, Recursion for
Homework.java
a) Implement the static method initializeArray that receives...
asked 6 hours ago -
Using C++, build a sorter that can rank a sequence of numbers in
a descending order....
asked 6 hours ago