


Homework Answers
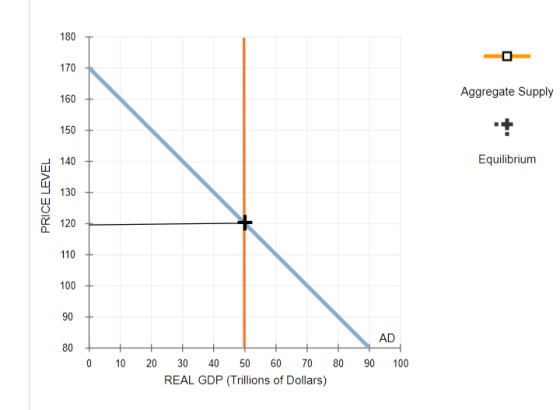
AS curve is Vertical at potential GDP level
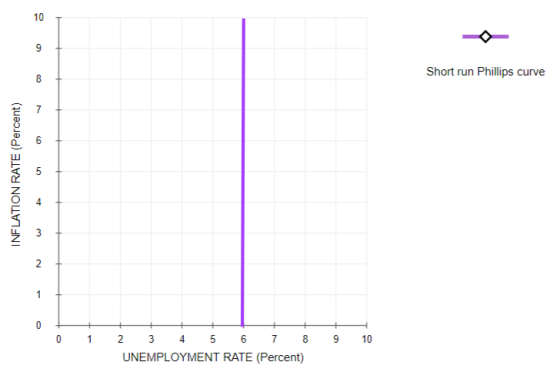
SRPC is Vertical at natural Unemployment rate, 6%
π= πe ( expected inflation)
.
As money supply Decrease, so
1) Decrease in inflation
2) no change in Unemployment
3) no change in real GDP
.
School of thought : rational expectations theory
Add Answer to:
Suppose that workers and firms perfectly forecast inflation, so that the real wage remains unchanged as...
An increase in the price level when the money wage rate remains unchanged increases _______
 The graph shows a long-run aggregate supply curve and a short-run aggregate supply curve. Draw an arrow along one of the curves that illustrate a rise in the price level when the money wage rate remains unchanged. Label it 1. Draw an arrow along one of the curves that illustrate a rise in the price level accompanied by the same percentage rise in the money wage rate. Label it 2.An increase in the price level when the money wage rate remains...
Which of the following statements are true based on these graphs? Check all that apply.
The following graphs show the state of an economy that is currently in long-run equilibrium. The first graph shows the aggregate demand (AD) and long-run aggregate supply (LRAS) curves. The second shows the long-run and short-run Phillips curves (LRPC and SRPC).ADLRAS0369121518PRICE LEVELOUTPUT (Trillions of dollars)AD LRAS SRPCLRPC024681012INFLATION RATEUNEMPLOYMENT RATE (Percent)SRPC LRPC Which of the following statements are true based on these graphs? Check all that apply.It is impossible to determine the natural rate of unemployment from these graphs alone.The natural rate of unemployment is 6%.The...
ECON 1150
In the year 2023, aggregate demand and aggregate supply in the fictional country of Gurder are represented by the curves AD2023AD2023 and AS on the following graph.Suppose the natural rate of output in this economy is $6 trillion.On the following graph, use the green line (triangle symbol) to plot the long-run aggregate-supply (LRAS) curve for this economy.LRASOutcome C0246810121416108107106105104103102101100PRICE LEVELOUTPUT (Trillions of dollars)ADAADBAD2023ABASEconomists have forecast that if the government does nothing and the economy continues to grow at the current rate, aggregate demand...
ECON 1150
In the year 2023, aggregate demand and aggregate supply in the fictional country of Gizmet are represented by the curves AD2023AD2023 and AS on the following graph. The price level is 102. The graph also shows two possible outcomes for 2024. The first potential aggregate-demand curve is given by the ADAADA curve, resulting in the outcome illustrated by point A. The second potential aggregate-demand curve is given by the ADBADB curve, resulting in the outcome illustrated by point B.0246810121416108107106105104103102101100PRICE LEVELOUTPUT (Trillions of dollars)ADAADBAD2023ABASSuppose the unemployment rate...
The graph shows the economy in long-run equilibrium Then the world economy expands and the demand...
 The graph shows the economy in long-run equilibrium Then the world economy expands and the demand for U.S.-produced goods increases Price level (GDP deflator, 2009-100) 14 Draw a curve that shows 1) the effect of increased demand for U.S.-produced goods. Label it 1 2) the effect of a rising money wage rate that returns the economy to full employment. Label it 2. Draw a point at the new long-run equilibrium 13 SAS 12 An economy is in a long-run equilibrium....
2. Phillips Curve. An economy has the following functions for its short run aggregate supply (SRAS),...
 2. Phillips Curve. An economy has the following functions for its short run aggregate supply (SRAS), Okun's Law (OL), and Phillips Curve (PC): SRAS: P = EP + (1/2)(y - 3) OL: (Y-Y) = -4(u-u") PC:T = ET - (1/5)( - 6) The economy begins at its natural rate of output with a stable price level equal to $5. a.) Output is at its natural level when the price level is equal to expectations. Calculate the natural rate of output...
2. Suppose the economy is in long-run equilibrium, with real GDP at $19 trillion and the unemployment rate at 5%. Now assume that the central bank unexpectedly decreases money supply by 6%. a) Illust...
 2. Suppose the economy is in long-run equilibrium, with real GDP at $19 trillion and the unemployment rate at 5%. Now assume that the central bank unexpectedly decreases money supply by 6%. a) Illustrate the short-run effects of the monetary policy by using aggregate demand-aggregate supply model. Be sure to indicate the direction of change in real GDP, the price level and the unemployment rate. b) Illustrate the long-run effects of the monetary policy by using aggregate demand-aggregate supply model....
The graph below depicts an economy where an increase in aggregate demand has caused inflation. The...
 The graph below depicts an economy where an increase in aggregate demand has caused inflation. The economy's current level of real GDP (Y2) is above its long-run equilibrium. This is illustrated by the long-run aggregate supply curve (LRAS) and a price level (P2) above the equilibrium value of Pe Fiscal Policy LRAS AS AD. 1 Real GDP Which of the following is an example of an automatic stabilizer that would help this economy move toward fll employment again? A reduction...
The graphs illustrate an initial equilibrium for the economy. Suppose that oil prices temporarily decrease Use...
 The graphs illustrate an initial equilibrium for the economy. Suppose that oil prices temporarily decrease Use the graphs to show the new positions of aggregate demand (AD), short-run aggregate supply (SRAS), and long-run aggregate supply (LRAS) in both the short run and the long run, as well as the short-run and long-run equilibriums resulting from this change. Then, indicate what happens to the price level and GDP in the short run and in the long run. Short-run graph Long-run graph...
Starting from the top drop down questions: 1. Fall / rise 2. 18% / 12% /...
 Starting from the top drop down
questions:
1. Fall / rise
2. 18% / 12% / 3% / 9% / 6% / 15 %
3. increase / decrease
4. up / down
5. more / less
6. an increase / no change / a decrease
7. an increase / no change / a decrease
8. an increase / no change / a decrease
3. The Keynesian transmission mechanism Suppose the Federal Reserve shifts to an expansionary monetary policy by buying...
Starting from the top drop down
questions:
1. Fall / rise
2. 18% / 12% / 3% / 9% / 6% / 15 %
3. increase / decrease
4. up / down
5. more / less
6. an increase / no change / a decrease
7. an increase / no change / a decrease
8. an increase / no change / a decrease
3. The Keynesian transmission mechanism Suppose the Federal Reserve shifts to an expansionary monetary policy by buying...
 The graph shows the economy in long-run equilibrium Then the world economy expands and the demand for U.S.-produced goods increases Price level (GDP deflator, 2009-100) 14 Draw a curve that shows 1) the effect of increased demand for U.S.-produced goods. Label it 1 2) the effect of a rising money wage rate that returns the economy to full employment. Label it 2. Draw a point at the new long-run equilibrium 13 SAS 12 An economy is in a long-run equilibrium....
 2. Phillips Curve. An economy has the following functions for its short run aggregate supply (SRAS), Okun's Law (OL), and Phillips Curve (PC): SRAS: P = EP + (1/2)(y - 3) OL: (Y-Y) = -4(u-u") PC:T = ET - (1/5)( - 6) The economy begins at its natural rate of output with a stable price level equal to $5. a.) Output is at its natural level when the price level is equal to expectations. Calculate the natural rate of output...
 2. Suppose the economy is in long-run equilibrium, with real GDP at $19 trillion and the unemployment rate at 5%. Now assume that the central bank unexpectedly decreases money supply by 6%. a) Illustrate the short-run effects of the monetary policy by using aggregate demand-aggregate supply model. Be sure to indicate the direction of change in real GDP, the price level and the unemployment rate. b) Illustrate the long-run effects of the monetary policy by using aggregate demand-aggregate supply model....
 The graph below depicts an economy where an increase in aggregate demand has caused inflation. The economy's current level of real GDP (Y2) is above its long-run equilibrium. This is illustrated by the long-run aggregate supply curve (LRAS) and a price level (P2) above the equilibrium value of Pe Fiscal Policy LRAS AS AD. 1 Real GDP Which of the following is an example of an automatic stabilizer that would help this economy move toward fll employment again? A reduction...
 The graphs illustrate an initial equilibrium for the economy. Suppose that oil prices temporarily decrease Use the graphs to show the new positions of aggregate demand (AD), short-run aggregate supply (SRAS), and long-run aggregate supply (LRAS) in both the short run and the long run, as well as the short-run and long-run equilibriums resulting from this change. Then, indicate what happens to the price level and GDP in the short run and in the long run. Short-run graph Long-run graph...
 Starting from the top drop down
questions:
1. Fall / rise
2. 18% / 12% / 3% / 9% / 6% / 15 %
3. increase / decrease
4. up / down
5. more / less
6. an increase / no change / a decrease
7. an increase / no change / a decrease
8. an increase / no change / a decrease
3. The Keynesian transmission mechanism Suppose the Federal Reserve shifts to an expansionary monetary policy by buying...
Starting from the top drop down
questions:
1. Fall / rise
2. 18% / 12% / 3% / 9% / 6% / 15 %
3. increase / decrease
4. up / down
5. more / less
6. an increase / no change / a decrease
7. an increase / no change / a decrease
8. an increase / no change / a decrease
3. The Keynesian transmission mechanism Suppose the Federal Reserve shifts to an expansionary monetary policy by buying...
Most questions answered within 3 hours.
-
To be done in java code. 2 words are anagrams if 1 word can be
formed...
asked 4 minutes ago -
Bright Sun, Inc. sold an issue of 30-year $1,000 par value bonds
to the public. The...
asked 1 minute ago -
Two players take turns at removing 1 to 4 coins from an original
pile of 16...
asked 25 seconds ago -
The income statement for the month of June, 2014 of Happy Smiles
Enterprises contains the following...
asked 6 minutes ago -
1-Calculate the mass in grams of 2.55 moles of KCl
2- Calculate how many moles are...
asked 6 minutes ago -
1. Choose value for p between 0.20 and 0.80. It should have at
least two decimal...
asked 8 minutes ago -
QUESTIONS: 500 words for the question
In defining abnormality, the criteria of “deviance”, “distress”
and “dysfunction”...
asked 9 minutes ago -
A sample of n = 25 scores produces a t statistic of t =
-2.062. If...
asked 27 minutes ago -
Given the following, compute the after tax cost of debt: The par
value of the firms...
asked 21 minutes ago -
Coding in C. Please only use stdio.h (which would mean no malloc
or anything like that)...
asked 26 minutes ago -
Use the fundamental accounting equation to find the missing
amounts.
Scenario
Assets
Liabilities
Equity
1
$...
asked 24 minutes ago -
A population has a mean of 200 and a standard deviation of 60.
Suppose a sample...
asked 28 minutes ago