
Homework Answers


![R RGUT (64-bit) - [R Console] R File Edit View Misc Packages Windows Help > * c 678396,73,85 69, 78, 80, 58, 65, 71,79,56,77,](http://img.homeworklib.com/questions/001a5220-45cd-11ec-97a8-2f0d69241b71.png?x-oss-process=image/resize,w_560) Here note that the histogram
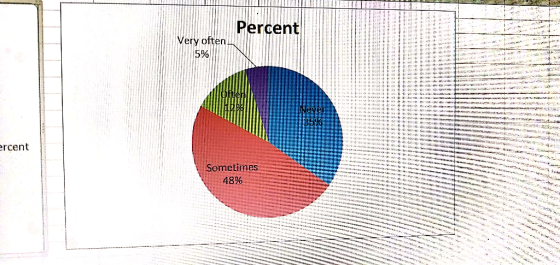
and the piechart is drawn by Excell and the anwer for c is
True
Here note that the histogram
and the piechart is drawn by Excell and the anwer for c is
True
And the second and third image is from R software
Just put as
x<-(67,83,……............,93)
hist(x) for histogram
boxplot(x) for boxplot
summary(x)
sd(x) for all summary about x.
Add Answer to:
This needs to be done in the RStudio program.
Lab-Worksheet-1 Due-03-06-2020 in Class 1. The National...
1. Ages of Vice Presidents at the Time of Their Death. The ages at the time...
 1. Ages of Vice Presidents at the Time of Their Death. The ages at the time of death of those Vice Presidents of the United States who have passed away are listed below. Do the following: a. Use the data to construct a frequency distribution. Use 6 classes. b. Find the relative frequency for the frequency distribution. c. Construct a histogram, frequency polygon, and ogive for the data. d. Construct a histogram, frequency polygon, and ogive using relative frequencies for...
A. Issues [1] In addition to damages for one year's notice period, can a trial judge...
 A. Issues [1] In addition to damages for one year's notice period, can a trial judge award significant damages for the mere fact of an employee's dismissal, or for the stigma that that dismissal brings? Or for the employer thereafter competing with the ex-employee for the clients, before the ex-employee has got a new job? B. Basic Facts [2] This is an appeal from 2009 ABQB 591 (CanLII), 473 A.R. 254. [3] Usually a judgment recites facts before law. But...
 1. Ages of Vice Presidents at the Time of Their Death. The ages at the time of death of those Vice Presidents of the United States who have passed away are listed below. Do the following: a. Use the data to construct a frequency distribution. Use 6 classes. b. Find the relative frequency for the frequency distribution. c. Construct a histogram, frequency polygon, and ogive for the data. d. Construct a histogram, frequency polygon, and ogive using relative frequencies for...
 A. Issues [1] In addition to damages for one year's notice period, can a trial judge award significant damages for the mere fact of an employee's dismissal, or for the stigma that that dismissal brings? Or for the employer thereafter competing with the ex-employee for the clients, before the ex-employee has got a new job? B. Basic Facts [2] This is an appeal from 2009 ABQB 591 (CanLII), 473 A.R. 254. [3] Usually a judgment recites facts before law. But...
Most questions answered within 3 hours.
-
3) What are the typical social structures in a global city?
asked 54 minutes ago -
Luther Corporation
Consolidated Balance Sheet
December 31, 2019 and 2018 (in $ millions)
Assets
2019
2018...
asked 56 minutes ago -
(Expected rate of return and risk) Carter Inc. is evaluating a
security. Calculate the investment’s expected...
asked 3 hours ago -
What specific indicators can point to lack of progress for
African Americans in American society?
asked 4 hours ago -
1-The Electrons in a beam are moving at 2.7×10⁸ m/s in an
electric field of 15000...
asked 4 hours ago -
A gas tank is a vertical cylinder. It has a radius of 1m, a
height of...
asked 5 hours ago -
Accent Software faces the following conditions. All of these
support Accent’s use of a market-penetration pricing...
asked 6 hours ago -
A mathematically inclined friend emails you the following
instructions: "Meet me in the cafeteria the first...
asked 6 hours ago -
A monopoly sells in two countries . The demand curves in the two
countries are p1...
asked 7 hours ago -
A .15kg rubber ball is bounced off a wall. Before hitting the
wall, the ball moves...
asked 7 hours ago -
A manufacturing company preparing to build a new plant is
considering three potential locations for it....
asked 8 hours ago -
B. If compound Y has approximately the same values of solubility
in toluene as compound X,...
asked 8 hours ago