
Homework Answers
The solution to this problem is given by

Add Answer to:
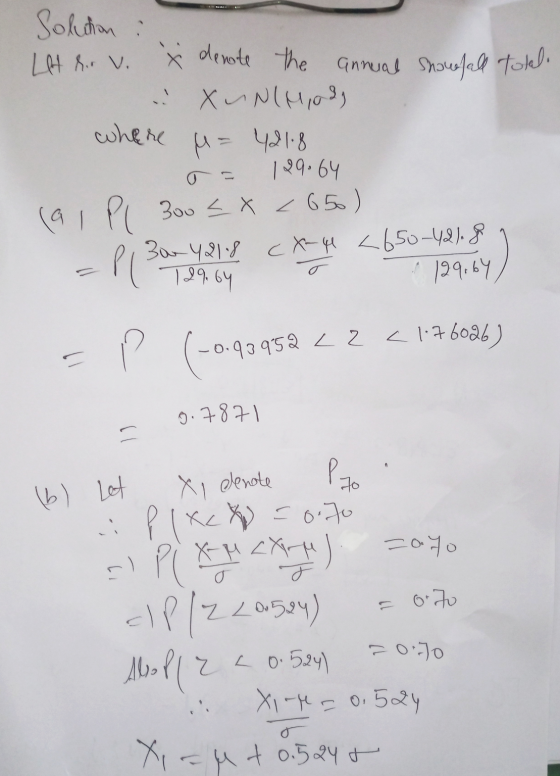
812 The annual snowfall total for Mammoth Mountain Ski Resort is a random variable having the...
Total Snowfall and Number of Visitors at Yellowstone National Park The tables below show the total...
Total Snowfall and Number of Visitors at Yellowstone National Park The tables below show the total snowfall (in inches) and the number of visitors to Yellowstone National Park during 18 randomly selected weeks. Total Snow Fall (inches) 8.3 28.9 13.8 10.7 23.5 24.8 Visitors 123,867 24,328 51,692 121,958 44,946 29,684 Total Snow Fall 28.3 29.7 5.3 1.3 21.3 16 Visitors 19,147 31,155 120,266 147,767 18,472 28,147 Total Snow Fall 0 29.7 0 2.5 6 24.4 Visitors 201,797 31,155 252,013 203,712...
Let x be a continuous random variable that is normally distributed with a mean of 25...
 Let x be a continuous random variable that is normally distributed with a mean of 25 and a standard deviation of 6. Find the probability that x assumes a value: a) between 29 and 36 b) between 22 and 35 Let x be a continuous random variable that is normally distributed with a mean of 80 and a standard deviation of 12. Find the probability that x assumes a value a) greater than 69 b) less than 73 c) greater...
Let be a random variable with a normal distribution having f59.6 and probability. (Round your answer...
 Let be a random variable with a normal distribution having f59.6 and probability. (Round your answer to four decimal places.) 18.5. Find the indicated P(x < 57.9) = Shade the corresponding area under the standard normal curve. 4.1 226 41.1 59.6 78.1 96.6 115.1 4.1 22.6 41.1 59.6 78.1 96.6 115.7 4.1 22.6 41.1 59.6 78.1 96.6 115.1 4.1 22.6 41. 1 59.6 78.1 96.6 115.1 Let a be a random variable with a normal distribution having p*59.6 and -18.5....
1) Let x be a continuous random variable that is normally distributed with a mean of...
1) Let x be a continuous random variable that is normally distributed with a mean of 21 and a standard deviation of 7. Find to 4 decimal places the probability that x assumes a value a. between 24 and 30. Probability = b. between 17 and 31. Probability = ------------------------------------------------------------------------------------------------------------------------------------------------------ 2) Let x be a continuous random variable that is normally distributed with a mean of 65 and a standard deviation of 15. Find the probability that x assumes a...
PLEASE ANSWER ALL QUESTION 1 1 points Save Answer A random variable is a uniform random...
 PLEASE ANSWER ALL
QUESTION 1 1 points Save Answer A random variable is a uniform random variable between 0 and 8. The probability density is 1/8, when 0<x<8 and O elsewhere. What is the probability that the random variable has a value greater than 2? QUESTION 2 1 points Save Answer The total area under a probability density curve of a continuous random variable is QUESTION 3 1 points Save Answer X is a continuous random variable with probability density...
PLEASE ANSWER ALL
QUESTION 1 1 points Save Answer A random variable is a uniform random variable between 0 and 8. The probability density is 1/8, when 0<x<8 and O elsewhere. What is the probability that the random variable has a value greater than 2? QUESTION 2 1 points Save Answer The total area under a probability density curve of a continuous random variable is QUESTION 3 1 points Save Answer X is a continuous random variable with probability density...
The random variable X is the number of color television sets owned by a randomly selected...
 The random variable X is the number of color television sets owned by a randomly selected household with an annual income between $15,000 and $29,999. Its probability distribution is shown below. Complete parts a through c. a. Find and interpret the mean of the random variable. Hx(Round to three decimal place as needed.) Interpret the mean. Choose the correct answer below 0 A. The observed value of the random variable will be equal to the mean of the random variable...
1. The continuous random variable X, has a uniform distribution over the interval from 23 to...
 1. The continuous random variable X, has a uniform distribution over the interval from 23 to 43. a) What in the probability density function in the interval between 23 to 43? 6. 7: Total : _ 16 14 /25 b) What is the probability that X is between 26 and 33? c) What is the mean of X? 2. Given that z is a standard normal random variable, a) what is the probability of z being greater than-1.53? b) if...
Find the indicated z score. The graph depicts the standard normal distribution with mean 0 and...
 Find the indicated z score. The graph depicts the standard normal distribution with mean 0 and standard deviation 1. 13) Shaded area is 0.9599. A) - 1.38 B) 1.03 1.82 D) 1.75 14) Shaded area is 0.0694. A) 1.45 B) 1.26 1.48 D) 1.39Find the indicated value. 15) z0.005 A) 2.535 D) 2.015 92.835 B) 2.575 16) z0.36 A) 1.76 B) 0.45 1.60 D) 0.36 Provide an appropriate response. 17) Find the area of the shaded region. The graph depicts IQ scores of adults, and those scores are normally distributed...
7. Let X be the random variable denoting the height of a randomly chosen adult individ- ual. If t...
 7. Let X be the random variable denoting the height of a randomly chosen adult individ- ual. If the individual is male, then X has a normal distribution with mean of = 70 inches with standard deviation of σ| 3.5 inches: while if the individual is female. then X has a normal distribution with mean μ0-66 inches and standard deviation of ơ0 3 inches. |Note: For computing probabilities and quantiles for the normal distribution, use the R functions pnorm, dnorm,...
7. Let X be the random variable denoting the height of a randomly chosen adult individ-...
 7. Let X be the random variable denoting the height of a randomly chosen adult individ- ual. If the individual is male, then X has a normal distribution with mean of = 70 inches with standard deviation of σ| 3.5 inches: while if the individual is female. then X has a normal distribution with mean μ0-66 inches and standard deviation of ơ0 3 inches. |Note: For computing probabilities and quantiles for the normal distribution, use the R functions pnorm, dnorm,...
 Let x be a continuous random variable that is normally distributed with a mean of 25 and a standard deviation of 6. Find the probability that x assumes a value: a) between 29 and 36 b) between 22 and 35 Let x be a continuous random variable that is normally distributed with a mean of 80 and a standard deviation of 12. Find the probability that x assumes a value a) greater than 69 b) less than 73 c) greater...
 Let be a random variable with a normal distribution having f59.6 and probability. (Round your answer to four decimal places.) 18.5. Find the indicated P(x < 57.9) = Shade the corresponding area under the standard normal curve. 4.1 226 41.1 59.6 78.1 96.6 115.1 4.1 22.6 41.1 59.6 78.1 96.6 115.7 4.1 22.6 41.1 59.6 78.1 96.6 115.1 4.1 22.6 41. 1 59.6 78.1 96.6 115.1 Let a be a random variable with a normal distribution having p*59.6 and -18.5....
 PLEASE ANSWER ALL
QUESTION 1 1 points Save Answer A random variable is a uniform random variable between 0 and 8. The probability density is 1/8, when 0<x<8 and O elsewhere. What is the probability that the random variable has a value greater than 2? QUESTION 2 1 points Save Answer The total area under a probability density curve of a continuous random variable is QUESTION 3 1 points Save Answer X is a continuous random variable with probability density...
PLEASE ANSWER ALL
QUESTION 1 1 points Save Answer A random variable is a uniform random variable between 0 and 8. The probability density is 1/8, when 0<x<8 and O elsewhere. What is the probability that the random variable has a value greater than 2? QUESTION 2 1 points Save Answer The total area under a probability density curve of a continuous random variable is QUESTION 3 1 points Save Answer X is a continuous random variable with probability density...
 The random variable X is the number of color television sets owned by a randomly selected household with an annual income between $15,000 and $29,999. Its probability distribution is shown below. Complete parts a through c. a. Find and interpret the mean of the random variable. Hx(Round to three decimal place as needed.) Interpret the mean. Choose the correct answer below 0 A. The observed value of the random variable will be equal to the mean of the random variable...
 1. The continuous random variable X, has a uniform distribution over the interval from 23 to 43. a) What in the probability density function in the interval between 23 to 43? 6. 7: Total : _ 16 14 /25 b) What is the probability that X is between 26 and 33? c) What is the mean of X? 2. Given that z is a standard normal random variable, a) what is the probability of z being greater than-1.53? b) if...
 7. Let X be the random variable denoting the height of a randomly chosen adult individ- ual. If the individual is male, then X has a normal distribution with mean of = 70 inches with standard deviation of σ| 3.5 inches: while if the individual is female. then X has a normal distribution with mean μ0-66 inches and standard deviation of ơ0 3 inches. |Note: For computing probabilities and quantiles for the normal distribution, use the R functions pnorm, dnorm,...
 7. Let X be the random variable denoting the height of a randomly chosen adult individ- ual. If the individual is male, then X has a normal distribution with mean of = 70 inches with standard deviation of σ| 3.5 inches: while if the individual is female. then X has a normal distribution with mean μ0-66 inches and standard deviation of ơ0 3 inches. |Note: For computing probabilities and quantiles for the normal distribution, use the R functions pnorm, dnorm,...
Most questions answered within 3 hours.
-
(a) A piston at 6.1 atm contains a gas that occupies a volume of
3.5 L....
asked 1 hour ago -
Please answer true or false. Words
cannot be changed or added in to make it true...
asked 1 hour ago -
An empty test tube weighs 15.923 grams. Then,
MgCl2•6H2O is added into the test tube. After...
asked 1 hour ago -
Assume memory access is 10 units of time and disk access is
10000 units of time....
asked 1 hour ago -
1. Are all good samples random?
2. Magazines often report surveys giving statistics such as “63%...
asked 1 hour ago -
Under all the various types of market structures, firms
must eventually earn some economic profits for...
asked 1 hour ago -
Consider the following fitness regime for a single locus trait
with two co-dominant alleles: w11 =...
asked 1 hour ago -
A large cable company reports the following.
80% of its customers subscribe to its cable TV...
asked 1 hour ago -
Please answer the question in brief.
Discuss the role of ERP in organizations. Are ERP tools...
asked 1 hour ago -
Discuss the pros and cons of collaborative software such
as SameTime. Does it increase productivity? What...
asked 1 hour ago -
Buying your in-laws a gift because it’s expected is
due to the ____________ motive of gift-giving....
asked 1 hour ago -
Calculate the expected value, the variance, and the standard
deviation of the given random variable X....
asked 2 hours ago