1.) Voting records show that 61% of eligible voters actually did vote in a recent presidential...
1.) Voting records show that 61% of eligible voters actually did vote in a recent presidential election. In a survey of 1002 people, 70% said that they voted in that election.
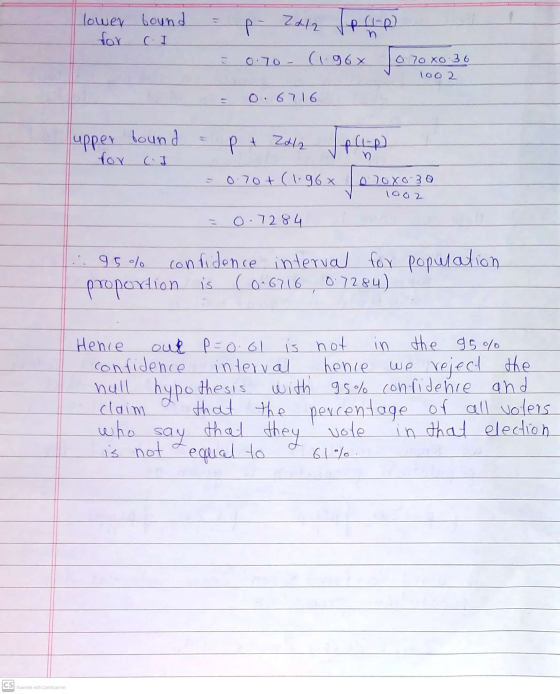
- Use the survey results to test the claim that the percentage of all voters who say that they voted is equal to 61%.
- Test the claim by constructing an appropriate confidence interval.
- What are the null and alternative hypotheses?
- What is the value of = significance level?
- Is the test two-tailed, left-tailed or right-tailed?
- What is the test statistic and what is its distribution?
- What is the value of the test statistic?
- What is the P-value?
- What is (are) the critical value(s)?
- How would you state a conclusion that addresses the original claim?
Homework Answers


 z
table as follows:
z
table as follows:

Add Answer to:
1.) Voting records show that 61% of eligible voters
actually did vote in a recent presidential...
1107 people, 816 people said they voted in a recent presidential election. Voting records show that...
1107 people, 816 people said they voted in a recent presidential election. Voting records show that 71% of eligible voters actually did vote. Given that 71% of eligible voters actually did vote, (a) find the probability that among 1107 randomly selected voters, at least 816 actually did vote. (b) What do the results from part (a) suggest? (a) P(X ≥816) ? round 4 decimals
In a survey of 1425 people, 1045 people said they voted in a recent presidential election....
In a survey of 1425 people, 1045 people said they voted in a recent presidential election. Voting records show that 71% of eligible voters actually did vote. Given that 71% of eligible voters actually did vote, (a) find the probability that among 1425 randomly selected voters, at least 1045 actually did vote. (b) What do the results from part (a) suggest?
In a survey of 13181318 people, 877877 people said they voted in a recent presidential election....
In a survey of 13181318 people, 877877 people said they voted in a recent presidential election. Voting records show that 6464% of eligible voters actually did vote. Given that 6464% of eligible voters actually did vote, (a) find the probability that among 13181318 randomly selected voters, at least 877877 actually did vote. (b) What do the results from part (a) suggest?
In a survey of 1145 people, 862 people said they voted in a recent presidential election....
In a survey of 1145 people, 862 people said they voted in a recent presidential election. Voting records show that 73% of eligible voters actually did vote. Given that 73% of eligible voters actually did vote, (a) find the probability that among 1145 randomly selected voters, at least 862 actually did vote. (b) What do the results from part (a) suggest? (a) P(X>862)=
In a survey of 1127 people, 739 people said they voted in a recent presidential election....
In a survey of 1127 people, 739 people said they voted in a recent presidential election. Voting records show that 63% of eligible voters actually did vote. Given that 63% of eligible voters actually did vote, (a) find the probability that among 1127 randomly selected voters, at least 739 actually did vote. (b) What do the results from part (a) suggest? (a) P(x≥739) = b) What does the result from part (a) suggest? A.People are being honest because the probability...
In a survey of 1466 people, 1049 people said they voted in a recent presidential election....
 In a survey of 1466 people, 1049 people said they voted in a recent presidential election. Voting records show that 69% of eligible voters actually did vote. Given that 69% of eligible voters actually did vote, (a) find the probability that among 1466 randomly selected voters, at least 1049 actually did vote. (b) What do the results from part (a) suggest? (a) P(X2 1049) = (Round to four decimal places as needed.) (b) What does the result from part (a)...
8. In a recent survey of 1002 people, 701 said that they voted in a recent presidential election. Voting records show that 61% of eligible voters actually did vote.
Please answer A), B) and C).A)Find the 95% confidence interval estimate of the proportion of people who say that they voted.B) Are the survey results consistent with the actual voter turnout of 61%? Why or why not?C) How would the confidence interval change if we increased the confidence level to 99%? Findthe 99% confidence interval estimate to support your answer.
M118 Worksheet Creating a Confidence interval, 2 Standard Deviation Approach (A) In a survey of 1002...
 M118 Worksheet Creating a Confidence interval, 2 Standard Deviation Approach (A) In a survey of 1002 people, 701 said that they had voted in a recent presidential election. Create a 9596 Cl for the percentage of all people who say they voted in the election () Voting records show that 61% of registered voters actually voted in the election, Is this data consistent with your CL. -250 +25D (2) A SRS of 1228 medical malpractice lawsults showed that 856 of...
31. Assume that women's heights are normally distributed with a mean given by μ=62.6 in, and...
31. Assume that women's heights are normally distributed with a mean given by μ=62.6 in, and a standard deviation given by σ=2.8 in. a. If 1 woman is randomly selected, find the probability that her height is between 62.2 in and 63.2 in.The probability is approximately (b) If 49 women are randomly selected, find the probability that they have a mean height less than 63 in .43. In a survey of 1345 people, 1029 people said they voted in a...
Given the sample data below, test the claim that the proportion of male voters who plan...
Given the sample data below, test the claim that the proportion of male voters who plan to vote Republican at the next presidential election is more than the percentage of female voters who plan to vote Republican. Use the P-value method of hypothesis testing and use a significance level of 0.10. Based on the result, can we say that Republicans resonate better with male voters than with female voters? Men: n1 = 250, x1 = 146 Women: n2 = 202,...
 In a survey of 1466 people, 1049 people said they voted in a recent presidential election. Voting records show that 69% of eligible voters actually did vote. Given that 69% of eligible voters actually did vote, (a) find the probability that among 1466 randomly selected voters, at least 1049 actually did vote. (b) What do the results from part (a) suggest? (a) P(X2 1049) = (Round to four decimal places as needed.) (b) What does the result from part (a)...
 M118 Worksheet Creating a Confidence interval, 2 Standard Deviation Approach (A) In a survey of 1002 people, 701 said that they had voted in a recent presidential election. Create a 9596 Cl for the percentage of all people who say they voted in the election () Voting records show that 61% of registered voters actually voted in the election, Is this data consistent with your CL. -250 +25D (2) A SRS of 1228 medical malpractice lawsults showed that 856 of...
Most questions answered within 3 hours.
-
What percent of revenue does net income represent for each
year?
Total Revenue
2017 = 60,319,000...
asked 17 minutes ago -
For Ti+2 (Z=22). Determine the correct ground state
& # of microstates. Use the correct tanabe...
asked 20 minutes ago -
Why did so many investment banks have to start buying CDO’s and
other mortgaged backed securities...
asked 35 minutes ago -
The mean cost of domestic airfares in the United States rose to
an all-time high of...
asked 46 minutes ago -
1.Magazine Luiza is a Brazilian retail chain for consumer
electronics. The company currently has 100 stores...
asked 45 minutes ago -
What is the molarity of ZnCl2 that forms when 25.0 g of zinc
completely reacts with...
asked 46 minutes ago -
For independent X and Y, we have probability density function
for them where pdf of X...
asked 57 minutes ago -
The decomposition of SO2Cl2 is first order in SO2Cl2 and has a
rate constant of 1.42...
asked 53 minutes ago -
How do I convert from volume percent to mole percent in the
distillation lab? ethy acetate...
asked 1 hour ago -
8. An air-plane has an effective wing surface area of 14.0 m²
that is generating the...
asked 1 hour ago -
A railroad worker was a person who worked on setting and moving
railroad tracks. In securing...
asked 59 minutes ago -
using RECURSIVE Functions in Java, create a public static String
doubleLetters (String word)
For ex) that...
asked 1 hour ago