Individual demand and consumer surplus
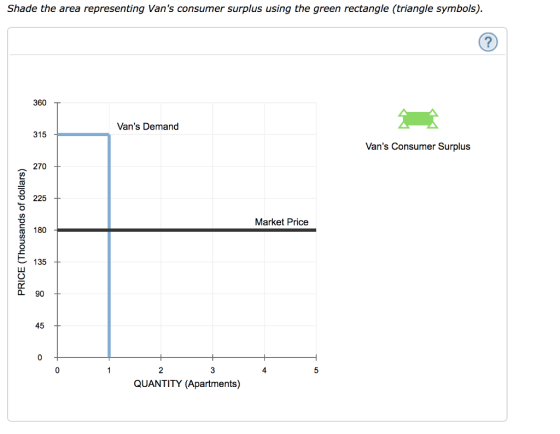
Consider the market for apartments. The market price of each
apartment is $180,000, and each buyer demands no more than one
apartment.
Suppose that Van is the only consumer in the apartment market. His
willingness to pay for an apartment is $315,000. Based on Van's
willingness to pay, the following graph shows his demand curve for
apartments.
Now, suppose another buyer, Amy, enters the market for apartments, and her willingness to pay is $225,000.
Based on Amy's and Van's respective willingness to pay, plot the market demand curve on the following graph using the blue points (circle symbol). Next, shade Van's consumer surplus using the green rectangle (triangle symbols), and shade Amy's consumer surplus using the purple rectangle (diamond symbols).
Note: Plot your points as a step function in the order in which you would like them connected. Line segments will connect the points automatically.

Homework Answers
Consumer surplus (CS) = Maximum willingness to pay (WTP) - Market price
(1) Van's CS is as follows.

(2) When Amy enters the market, her WTP > Market price and therefore, at price of $180,000, quantity demanded = 2 (= Number of consumers: Van & Amy). Demand curve is drawn and CS are marked as follows. Since the area of CS overlaps, I've labelled them as follows (do not include the labels in your actual graph):
Van's CS = Area ABCD
Amy's CS = Area DGFE

(3) TRUE
Since Carlos's WTP < Market price, Carlos will not buy.
Add Answer to:
Individual demand and consumer surplus
Consider the market for apartments. The market price of each
apartment...
2. Individual demand and consumer surplus Consider the market for apartments. The market price of each...
 2. Individual demand and consumer surplus Consider the market for apartments. The market price of each apartment is $180,000, and each buyer demands no more than one apartment. Suppose that Kevin is the only consumer in the apartment market. His willingness to pay for an apartment is $315,000. Based on Kevin's willingness to pay, the following graph shows his demand curve for apartments. Shade the area representing Kevin's consumer surplus using the green rectangle (triangle symbols) 360 Kevin's Demand 315...
Consider the market for apartments. The market price of each apartment is $300,000, and each buyer...
 Consider the market for apartments. The market price of each apartment is $300,000, and each buyer demands no more than one apartment. Suppose that Larry is the only consumer in the apartment market. His willingness to pay for an apartment is $480,000. Based on Larry's willingness to pay, the following graph shows his demand curve for apartments. Shade the area representing Larry's consumer surplus using the green rectangle (triangle symbols). Larry's Demand Larry's Consumer Surplus Market Price PRICE (Thousands of...
Individual demand and consumer surplus Consider the market for yachts. The market price of each yacht...
 Individual demand and consumer surplus
Consider the market for yachts. The market price of each yacht
is $180,000, and each buyer demands no more than one yacht.
Suppose that Clancy is the only consumer in the yacht market.
His willingness to pay for a yacht is $315,000. Based on Clancy's
willingness to pay, the following graph shows his demand curve for
yachts.
Shade the area representing Clancy's consumer surplus using the
green rectangle (triangle symbols).
Now, suppose another buyer, Eileen,...
Individual demand and consumer surplus
Consider the market for yachts. The market price of each yacht
is $180,000, and each buyer demands no more than one yacht.
Suppose that Clancy is the only consumer in the yacht market.
His willingness to pay for a yacht is $315,000. Based on Clancy's
willingness to pay, the following graph shows his demand curve for
yachts.
Shade the area representing Clancy's consumer surplus using the
green rectangle (triangle symbols).
Now, suppose another buyer, Eileen,...
2. Individual demand and consumer surplus Consider the market for yachts. The market price of each...
 2. Individual demand and consumer surplus
Consider the market for yachts. The market price of each yacht
is $350,000, and each buyer demands no more than one yacht.
Suppose that Sam is the only consumer in the yacht market. His
willingness to pay for a yacht is $560,000. Based on Sam's
willingness to pay, the following graph shows his demand curve for
yachts.
Shade the area representing Sam's consumer surplus using the
green rectangle (triangle symbols).
Now, suppose another buyer,...
2. Individual demand and consumer surplus
Consider the market for yachts. The market price of each yacht
is $350,000, and each buyer demands no more than one yacht.
Suppose that Sam is the only consumer in the yacht market. His
willingness to pay for a yacht is $560,000. Based on Sam's
willingness to pay, the following graph shows his demand curve for
yachts.
Shade the area representing Sam's consumer surplus using the
green rectangle (triangle symbols).
Now, suppose another buyer,...
2. Individual demand and consumer surplus Consider the market for yachts. The market price of each...
 2. Individual demand and consumer surplus Consider the market for yachts. The market price of each yacht is $140,000, and each buyer demands no more than one yacht. Suppose that Bob is the only consumer in the yacht market. His willingness to pay for a yacht is $245,000. Based on Bob's willingness to pay, the following graph shows his demand curve for yachts. Shade the area representing Bob's consumer surplus using the green rectangle (triangle symbols). Bob's Demand Bob's Consumer...
please help. show coordinates for demand curve as well 2. Individual demand and consumer surplus Consider...
 please help. show coordinates for demand curve as well
2. Individual demand and consumer surplus Consider the market for yachts. The market price of each yacht is $140,000, and each buyer demands no more than one yacht. Suppose that Raphael is the only consumer in the yacht market. His willingness to pay for a yacht is $245,000. Based on Raphael's willingness to pay, the following graph shows his demand curve for yachts. Shade the area representing Raphael's consumer surplus using...
please help. show coordinates for demand curve as well
2. Individual demand and consumer surplus Consider the market for yachts. The market price of each yacht is $140,000, and each buyer demands no more than one yacht. Suppose that Raphael is the only consumer in the yacht market. His willingness to pay for a yacht is $245,000. Based on Raphael's willingness to pay, the following graph shows his demand curve for yachts. Shade the area representing Raphael's consumer surplus using...
CENGAGE MINDTAP Homework (Ch 07) 2. Individual demand and consumer surplus Consider the market for antique...
 CENGAGE MINDTAP Homework (Ch 07) 2. Individual demand and consumer surplus Consider the market for antique cars. The market price of each antique car is $200,000, and each buyer demands no more than one am Suppose that Kevin is the only consumer in the antique car market. His willingness to pay for an antique car is $320,000. Based on ke to pay, the following graph shows his demand curve for antique cars. Shade the area representing Kevin's consumer surplus using...
Consider the market for antique cars. The market price of each antique car is $300,000, and each buyer demands no more than one antique car
 2. Individual demand and consumer surplus Consider the market for antique cars. The market price of each antique car is $300,000, and each buyer demands no more than one antique car Suppose that Gilberto is the only consumer in the antique car market. His willingness to pay for an antique car is $480,000. Based on Gilberto's Willingness to pay, the following graph shows his demand curve for antique cars. Shade the area representing Gilberto's consumer surplus using the green rectangle (triangle symbols).Now, suppose...
3. Consumer surplus for a group of consumers The following graph shows the demand curve for...
 3. Consumer surplus for a group of consumers The following graph shows the demand curve for a group of consumers in the U.S. market (blue line) for laptops. The market price of a laptop is shown by the black horizontal line at $90 Each rectangle you can place on the following graph corresponds to a particular buyer in this market: orange (square symbols) for Alex, green (triangle symbols) for Becky, purple (diamond symbols) for Clancy, tan (dash symbols) for Eileen,...
3. Consumer surplus for a group of consumers The following graph shows the demand curve for...
 3. Consumer surplus for a group of consumers The following graph shows the demand curve for a group of consumers in the U.S. market (blue line) for smartphones. The market price of a smartphone is shown by the black horizontal line at $150. Each rectangle you can place on the following graph corresponds to a particular buyer in this market: orange (square symbols) for Bob, green (triangle symbols) for Cha, purple (diamond symbols) for Eric, tan (dash symbols) for Ginny,...
 2. Individual demand and consumer surplus Consider the market for apartments. The market price of each apartment is $180,000, and each buyer demands no more than one apartment. Suppose that Kevin is the only consumer in the apartment market. His willingness to pay for an apartment is $315,000. Based on Kevin's willingness to pay, the following graph shows his demand curve for apartments. Shade the area representing Kevin's consumer surplus using the green rectangle (triangle symbols) 360 Kevin's Demand 315...
 Consider the market for apartments. The market price of each apartment is $300,000, and each buyer demands no more than one apartment. Suppose that Larry is the only consumer in the apartment market. His willingness to pay for an apartment is $480,000. Based on Larry's willingness to pay, the following graph shows his demand curve for apartments. Shade the area representing Larry's consumer surplus using the green rectangle (triangle symbols). Larry's Demand Larry's Consumer Surplus Market Price PRICE (Thousands of...
 Individual demand and consumer surplus
Consider the market for yachts. The market price of each yacht
is $180,000, and each buyer demands no more than one yacht.
Suppose that Clancy is the only consumer in the yacht market.
His willingness to pay for a yacht is $315,000. Based on Clancy's
willingness to pay, the following graph shows his demand curve for
yachts.
Shade the area representing Clancy's consumer surplus using the
green rectangle (triangle symbols).
Now, suppose another buyer, Eileen,...
Individual demand and consumer surplus
Consider the market for yachts. The market price of each yacht
is $180,000, and each buyer demands no more than one yacht.
Suppose that Clancy is the only consumer in the yacht market.
His willingness to pay for a yacht is $315,000. Based on Clancy's
willingness to pay, the following graph shows his demand curve for
yachts.
Shade the area representing Clancy's consumer surplus using the
green rectangle (triangle symbols).
Now, suppose another buyer, Eileen,...
 2. Individual demand and consumer surplus
Consider the market for yachts. The market price of each yacht
is $350,000, and each buyer demands no more than one yacht.
Suppose that Sam is the only consumer in the yacht market. His
willingness to pay for a yacht is $560,000. Based on Sam's
willingness to pay, the following graph shows his demand curve for
yachts.
Shade the area representing Sam's consumer surplus using the
green rectangle (triangle symbols).
Now, suppose another buyer,...
2. Individual demand and consumer surplus
Consider the market for yachts. The market price of each yacht
is $350,000, and each buyer demands no more than one yacht.
Suppose that Sam is the only consumer in the yacht market. His
willingness to pay for a yacht is $560,000. Based on Sam's
willingness to pay, the following graph shows his demand curve for
yachts.
Shade the area representing Sam's consumer surplus using the
green rectangle (triangle symbols).
Now, suppose another buyer,...
 2. Individual demand and consumer surplus Consider the market for yachts. The market price of each yacht is $140,000, and each buyer demands no more than one yacht. Suppose that Bob is the only consumer in the yacht market. His willingness to pay for a yacht is $245,000. Based on Bob's willingness to pay, the following graph shows his demand curve for yachts. Shade the area representing Bob's consumer surplus using the green rectangle (triangle symbols). Bob's Demand Bob's Consumer...
 please help. show coordinates for demand curve as well
2. Individual demand and consumer surplus Consider the market for yachts. The market price of each yacht is $140,000, and each buyer demands no more than one yacht. Suppose that Raphael is the only consumer in the yacht market. His willingness to pay for a yacht is $245,000. Based on Raphael's willingness to pay, the following graph shows his demand curve for yachts. Shade the area representing Raphael's consumer surplus using...
please help. show coordinates for demand curve as well
2. Individual demand and consumer surplus Consider the market for yachts. The market price of each yacht is $140,000, and each buyer demands no more than one yacht. Suppose that Raphael is the only consumer in the yacht market. His willingness to pay for a yacht is $245,000. Based on Raphael's willingness to pay, the following graph shows his demand curve for yachts. Shade the area representing Raphael's consumer surplus using...
 CENGAGE MINDTAP Homework (Ch 07) 2. Individual demand and consumer surplus Consider the market for antique cars. The market price of each antique car is $200,000, and each buyer demands no more than one am Suppose that Kevin is the only consumer in the antique car market. His willingness to pay for an antique car is $320,000. Based on ke to pay, the following graph shows his demand curve for antique cars. Shade the area representing Kevin's consumer surplus using...
 3. Consumer surplus for a group of consumers The following graph shows the demand curve for a group of consumers in the U.S. market (blue line) for laptops. The market price of a laptop is shown by the black horizontal line at $90 Each rectangle you can place on the following graph corresponds to a particular buyer in this market: orange (square symbols) for Alex, green (triangle symbols) for Becky, purple (diamond symbols) for Clancy, tan (dash symbols) for Eileen,...
 3. Consumer surplus for a group of consumers The following graph shows the demand curve for a group of consumers in the U.S. market (blue line) for smartphones. The market price of a smartphone is shown by the black horizontal line at $150. Each rectangle you can place on the following graph corresponds to a particular buyer in this market: orange (square symbols) for Bob, green (triangle symbols) for Cha, purple (diamond symbols) for Eric, tan (dash symbols) for Ginny,...
Most questions answered within 3 hours.
-
A baseball batter hits a 0.145kg baseball straight up into the
air. The baseball leaves the...
asked 18 minutes ago -
An FM modulator is tested using
single-tone baseband signal with frequency of 50kHz and a sprectrum...
asked 38 minutes ago -
Write the ionic equations for the first stage of salts
hydrolysis.
Anion, Cation?
Na2S
NiSO4
K2SO4...
asked 2 hours ago -
suppose there is a normally distributed population with a mean of
250 and a standard deviation...
asked 2 hours ago -
Question Three
Suppose you as project manager are using the Waterfall
development methodology on a large...
asked 3 hours ago -
Which statement is not true about welfare in Canada?
A.Benefits typically vary based on one's ability...
asked 4 hours ago -
Please help me with FLOWCHART and UML diagram for class,
thank you!
#include <iostream>
#include <fstream>...
asked 5 hours ago -
3. Describe the “logic circuit” of the Lac operon. Which
proteins are bound or not to...
asked 5 hours ago -
Ayesha’s adjusted gross income is $60,000 in 2019. She donated a
piece of artwork with a...
asked 5 hours ago -
For Dijkstra’s shortest path algorithm:
a. Give the Big-O time for Dijkstra’s shortest path algorithm
and...
asked 5 hours ago -
Phosphorus violates the 'octet rule' in biological molecules,
forming more covalent bonds than expected based on...
asked 5 hours ago -
A 1.3 eV electron has a 10-4 probability of tunneling
through a 2.4 eV potential barrier....
asked 5 hours ago