

Homework Answers
Dear student we can provide you with the solution of 1 question at a time.
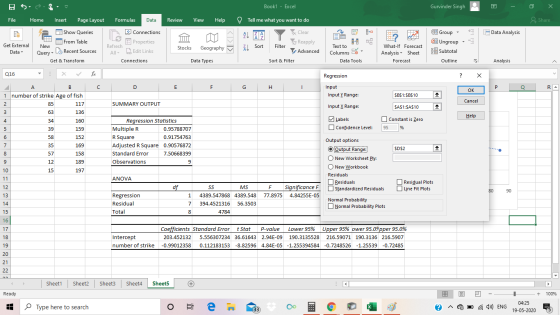
1)
a)

b)The plot appears to be very linear as the data points are close to the line of best fit. The slope is reducingwhich tells that there is a negative relationship between the two variable.
c) Correlation is 0.9175 which is close to 1, Hence correlation tend to agree with scatterplot assessment.
Add Answer to:
Math 243 Activity #4 Correlation Names Do the following problems with your team. Show all your...
1. Find and interpret the coefficient of determination, r squared r2. Select the correct choice ...
 1.
Find and interpret the coefficient of determination,
r squared
r2. Select the correct choice below and fill in the answer box
within your choice.
2.
Find and interpret the coefficient of determination,
r squared
r2. Select the correct choice below and fill in the answer box
within your choice.
The quality of the crange juice produced by a cerlain manufaclurer is constantly monitored. Data collected on the swectness index of an orange juice sample and amount of water-soluble pectin...
1.
Find and interpret the coefficient of determination,
r squared
r2. Select the correct choice below and fill in the answer box
within your choice.
2.
Find and interpret the coefficient of determination,
r squared
r2. Select the correct choice below and fill in the answer box
within your choice.
The quality of the crange juice produced by a cerlain manufaclurer is constantly monitored. Data collected on the swectness index of an orange juice sample and amount of water-soluble pectin...
4.3 Analysis Assignment #4 Note 1: all assignments moving forward must adhere to the appropriate Six Ste...
 4.3 Analysis Assignment #4 Note 1: all assignments moving forward must adhere to the appropriate Six Step Process (SSP). As our study materials have specified, the SSP has 3 versions. Version 1 is to be used for all t-tests; for all correlation analyses and Version 3 is be used for all regression analyses. Note 2: The data sets for Q1, Q2 and Q3 below can be downloaded here. Week 4 Analysis Assignments.xlsx Q1: (30 points) Complete the following data analysis:...
2. Using the data set of the Health Exam Results, conduct the following analysis between the variables of weight (WT) and Body Mass Index (BMI). Number the data set from 1 to 40, and select the...
 2. Using the data set of the Health Exam Results, conduct the following analysis between the variables of weight (WT) and Body Mass Index (BMI). Number the data set from 1 to 40, and select the following individuals: . Set 1 (Malo): 1, 5, 10, 13, 15, 18, 19, 24, 29, 31, 32, 33 .Set 2 (Fomalo): 4, 9, 15, 16, 17, 22, 23, 29, 33, 37, 38, 40 Draw a scatter diagram of the sample of 12 data set...
Please complete for Tuesday, we will go through the questions and mark them in class. pg 156 - 4.23,...
 Please complete for Tuesday, we will go through the questions and mark them in class. pg 156 - 4.23, 4.24, 4.26 pg 170 - 4.29, 4.31, pg 171-4.36 pg 175 - 4.59 pg 176- 4.74, 4.75, 4.80 pg 177-4.81, 4.82 pg 188- 5.1, 5.4, 5.5, 5.6, 5.11 - Using Table 5.1 pg 198-5.22, 5.25 pg 203 - 5.29 pg 206 - 5.37 pg 209 - 5.39 pg 2.14 5.61 pg 235-6.11, 6.14, 6.16 156 CHAPTER 4 Introduction to Organic Compounds...
 1.
Find and interpret the coefficient of determination,
r squared
r2. Select the correct choice below and fill in the answer box
within your choice.
2.
Find and interpret the coefficient of determination,
r squared
r2. Select the correct choice below and fill in the answer box
within your choice.
The quality of the crange juice produced by a cerlain manufaclurer is constantly monitored. Data collected on the swectness index of an orange juice sample and amount of water-soluble pectin...
1.
Find and interpret the coefficient of determination,
r squared
r2. Select the correct choice below and fill in the answer box
within your choice.
2.
Find and interpret the coefficient of determination,
r squared
r2. Select the correct choice below and fill in the answer box
within your choice.
The quality of the crange juice produced by a cerlain manufaclurer is constantly monitored. Data collected on the swectness index of an orange juice sample and amount of water-soluble pectin...
 4.3 Analysis Assignment #4 Note 1: all assignments moving forward must adhere to the appropriate Six Step Process (SSP). As our study materials have specified, the SSP has 3 versions. Version 1 is to be used for all t-tests; for all correlation analyses and Version 3 is be used for all regression analyses. Note 2: The data sets for Q1, Q2 and Q3 below can be downloaded here. Week 4 Analysis Assignments.xlsx Q1: (30 points) Complete the following data analysis:...
 2. Using the data set of the Health Exam Results, conduct the following analysis between the variables of weight (WT) and Body Mass Index (BMI). Number the data set from 1 to 40, and select the following individuals: . Set 1 (Malo): 1, 5, 10, 13, 15, 18, 19, 24, 29, 31, 32, 33 .Set 2 (Fomalo): 4, 9, 15, 16, 17, 22, 23, 29, 33, 37, 38, 40 Draw a scatter diagram of the sample of 12 data set...
 Please complete for Tuesday, we will go through the questions and mark them in class. pg 156 - 4.23, 4.24, 4.26 pg 170 - 4.29, 4.31, pg 171-4.36 pg 175 - 4.59 pg 176- 4.74, 4.75, 4.80 pg 177-4.81, 4.82 pg 188- 5.1, 5.4, 5.5, 5.6, 5.11 - Using Table 5.1 pg 198-5.22, 5.25 pg 203 - 5.29 pg 206 - 5.37 pg 209 - 5.39 pg 2.14 5.61 pg 235-6.11, 6.14, 6.16 156 CHAPTER 4 Introduction to Organic Compounds...
Most questions answered within 3 hours.
-
Nature Conservancy's leader abruptly steps
down.
One morning in October 2007, Steven. J. McCormick the president...
asked 49 seconds ago -
I asked a question similar to this one, which was answered
perfectly. Another practice problem is...
asked 9 minutes ago -
Rachel is studying cholesterol synthesis in mice. Some mice
had a mutation in their sterol regulatory...
asked 6 minutes ago -
Railco sells to its customers on account with terms of 2% / 5
/net 15. Ronco...
asked 13 minutes ago -
Refer to the following lease amortization schedule. The 10
payments are made annually starting with the...
asked 28 minutes ago -
Explain how God fits into Aquinas' theory of happiness.
asked 35 minutes ago -
1.1 With aid of diagrams and suitable examples discuss
the economic effects of price controls.
1.2...
asked 40 minutes ago -
When the nuclide polonium-214 undergoes alpha
decay:
The name of the product nuclide is .
The...
asked 54 minutes ago -
Q. The market demand function is D(Pd) = 160 - 2Pd and the
market supply function...
asked 59 minutes ago -
An unknown alcohol is analyzed by freezing point depression. The
unknown is either methanol (CH3OH), ethanol...
asked 1 hour ago -
As a person inhales, air moves down the windpipe (bronchus),
through a constriction where the air...
asked 1 hour ago -
Youngchang Keyboard sells a $1400 keyboard on a monthly payment
plan over 2 years.
a) If...
asked 1 hour ago