The data in the table is the number of absences for 7 students and their corresponding...
The data in the table is the number of absences for 7 students and their corresponding grade.
| Number of Absences | 0 | 0 | 2 | 2 | 4 | 4 | 5 |
|---|---|---|---|---|---|---|---|
| Grade | 3.3 | 3 | 2.1 | 1.8 | 1.8 | 1.7 | 1.6 |
Step 1 of 5: Calculate the sum of squared errors (SSE). Use the values b0=2.9391 and b1=−0.3102 for the calculations. Round your answer to three decimal places.
Step 2 of 5: Calculate the estimated variance of errors, s2e. Round your answer to three decimal places.
Step 3 of 5: Calculate the estimated variance of slope, s2b1. Round your answer to three decimal places.
Step 4 of 5: Construct the 80% confidence interval for the slope. Round your answers to three decimal places.
Step 5 of 5: Construct the 95% confidence interval for the slope. Round your answers to three decimal places.
Homework Answers
The statistical software output for this problem is:

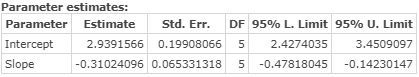
Hence,
Step - 1: SSE = 0.506
Step - 2: s2e = 0.101
Step - 3: s2b1 = (0.06533)2 = 0.004
Step - 4: 80% confidence interval:
Lower limit = -0.407
Upper limit = -0.214
Step - 5: 95% confidence interval:
Lower limit = -0.478
Upper limit = -0.142
Add Answer to:
The data in the table is the number of absences for 7 students
and their corresponding...
The data in the table is the number of absences for students and their corresponding grade....
 The data in the table is the number of absences for students and their corresponding grade. ces 1 3.7 1 3.1 2 2.2 5 2.1 6 2 7 1.7 8 1.7 Grade Table Copy Data Step 1 of 5: Calculate the sum of squared errors (SSE). Use the values bo three decimal places 3.3167 and b = -0.2239 for the calculations. Round your answer to Answer How to Enter 2 Points Tables Keypad Lewis Learning The data in the table...
The following data give the number of hours 5 students spent studying and their corresponding grades...
The following data give the number of hours 5 students spent studying and their corresponding grades on their midterm exams. Hours Studying 0 0 2 3 4 Midterm Grades 61 73 84 86 100 a.Calculate the sum of squared errors (SSE). Use the values b0=66.9062 and b1=7.7188 for the calculations. Round your answer to three decimal places. b. Calculate the estimated variance of errors, s2e. c. Calculate the estimated variance of the slope, s2b1. d. Construct the 90% confidence interval...
Step 2 of 5: Calculate the estimated variance of errors, s2e. Round your answer to three...
 Step 2 of 5: Calculate the estimated variance of errors,
s2e. Round your answer to three decimal
places.
Step 3 of 5: Calculate the estimated variance of slope,
s2b1. Round your answer to three decimal
places.
Step 4 of 5: Construct the 90% confidence interval for the
slope. Round your answers to three decimal places.
Step 5 of 5: Construct the 98% confidence interval for the
slope. Round your answers to three decimal places.
The data in the table is...
Step 2 of 5: Calculate the estimated variance of errors,
s2e. Round your answer to three decimal
places.
Step 3 of 5: Calculate the estimated variance of slope,
s2b1. Round your answer to three decimal
places.
Step 4 of 5: Construct the 90% confidence interval for the
slope. Round your answers to three decimal places.
Step 5 of 5: Construct the 98% confidence interval for the
slope. Round your answers to three decimal places.
The data in the table is...
Step 2 of 7 : Calculate the estimated variance of errors, s2e. Round your answer to...
 Step 2 of 7 :
Calculate the estimated variance of errors, s2e. Round your
answer to three decimal places.
Step 3 of 7 :
Calculate the estimated variance of slope, s2b1. Round your
answer to three decimal places.
Step 4 of 7 :
Construct the 98% confidence interval for the slope. Round your
answers to three decimal places.
Lower and upper end point:
Step 5 of 7 :
Construct the 95% confidence interval for the slope. Round your
answers to...
Step 2 of 7 :
Calculate the estimated variance of errors, s2e. Round your
answer to three decimal places.
Step 3 of 7 :
Calculate the estimated variance of slope, s2b1. Round your
answer to three decimal places.
Step 4 of 7 :
Construct the 98% confidence interval for the slope. Round your
answers to three decimal places.
Lower and upper end point:
Step 5 of 7 :
Construct the 95% confidence interval for the slope. Round your
answers to...
The data in the table is the number of absences for 7 students and their corresponding...
 The data in the table is the number of absences for 7 students and their corresponding grade Number of Absences 11 2 2 3 3 7 Grade 4|3.7 | 3.5 I 27 I 2.4 | 1.7|1.7 Step 5 of 5 : Construct the 99 % confidence interval for the slope. Round your answers to three decimal places Previous Answers b -0.3607 bo 3.7933 Lower endpoint Upper endpoint SSE 2021 20.404 0016
The data in the table is the number of absences for 7 students and their corresponding...
The data in the table is the number of absences for 7 students and their corresponding grade. Number of Absences 1 1 4 5 6 7 7 Grade 3.8 3.4 3.3 2.8 2.1 1.6 1.6 Table Copy Data Step 1 of 5: Calculate the sum of squared errors (SSE). Use the values b0=4.1035 and b1=−0.3266 for the calculations. Round your answer to three decimal places.
The following table compares the completion percentage and interception percentage of 55 NFL quarterbacks. Completion Percentage...
The following table compares the completion percentage and interception percentage of 55 NFL quarterbacks. Completion Percentage 57 60 62 63 64 Interception Percentage 4.7 4.4 3.5 2.5 2.4 Step 1 of 5 : Calculate the sum of squared errors (SSE). Use the values b0=25.3545 and b1=−0.3571 for the calculations. Round your answer to three decimal places. Step 2 of 6: Calculate the estimated variance of errors, s2e. Round your answer to three decimal places. Answer = Step 3 of 6:...
Step 1 of 7 : Calculate the sum of squared errors (SSE). Use the values above....
 Step 1 of 7 :
Calculate the sum of squared errors (SSE). Use the values above.
Round your answer to three decimal places.
Step 2 of 7 :
Calculate the estimated variance of errors, s2e. Round your
answer to three decimal places.
Step 3 of 7 :
Calculate the estimated variance of slope, s2b1. Round your
answer to three decimal places.
Step 4 of 7 :
Construct the 98% confidence interval for the slope. Round your
answers to three decimal...
Step 1 of 7 :
Calculate the sum of squared errors (SSE). Use the values above.
Round your answer to three decimal places.
Step 2 of 7 :
Calculate the estimated variance of errors, s2e. Round your
answer to three decimal places.
Step 3 of 7 :
Calculate the estimated variance of slope, s2b1. Round your
answer to three decimal places.
Step 4 of 7 :
Construct the 98% confidence interval for the slope. Round your
answers to three decimal...
The following table compares the completion percentage and interception percentage of 5 NFL quarterbacks. Completion Percentage...
The following table compares the completion percentage and interception percentage of 5 NFL quarterbacks. Completion Percentage 55 58 58 60 64 Interception Percentage 4.5 4.5 4 3.5 3 Step 1 of 5: Calculate the sum of squared errors (SSE). Use the values b0=14.6262 and b1=−0.1818 for the calculations. Round your answer to three decimal places. Step 2 of 5: Calculate the estimated variance of errors, se2. Round your answer to three decimal places. Step 3 of 5: Calculate the estimated...
The data in the table is the number of absences for 77 students and their corresponding...
The data in the table is the number of absences for 77 students and their corresponding grade. Number of Absences 0 0 2 3 4 5 6 Grade 3.8 3.7 3.5 3.5 3.4 3.1 1.5 Step 4 of 5 : Construct the 99% confidence interval for the slope. Round your answers to three decimal places.
 The data in the table is the number of absences for students and their corresponding grade. ces 1 3.7 1 3.1 2 2.2 5 2.1 6 2 7 1.7 8 1.7 Grade Table Copy Data Step 1 of 5: Calculate the sum of squared errors (SSE). Use the values bo three decimal places 3.3167 and b = -0.2239 for the calculations. Round your answer to Answer How to Enter 2 Points Tables Keypad Lewis Learning The data in the table...
 Step 2 of 5: Calculate the estimated variance of errors,
s2e. Round your answer to three decimal
places.
Step 3 of 5: Calculate the estimated variance of slope,
s2b1. Round your answer to three decimal
places.
Step 4 of 5: Construct the 90% confidence interval for the
slope. Round your answers to three decimal places.
Step 5 of 5: Construct the 98% confidence interval for the
slope. Round your answers to three decimal places.
The data in the table is...
Step 2 of 5: Calculate the estimated variance of errors,
s2e. Round your answer to three decimal
places.
Step 3 of 5: Calculate the estimated variance of slope,
s2b1. Round your answer to three decimal
places.
Step 4 of 5: Construct the 90% confidence interval for the
slope. Round your answers to three decimal places.
Step 5 of 5: Construct the 98% confidence interval for the
slope. Round your answers to three decimal places.
The data in the table is...
 Step 2 of 7 :
Calculate the estimated variance of errors, s2e. Round your
answer to three decimal places.
Step 3 of 7 :
Calculate the estimated variance of slope, s2b1. Round your
answer to three decimal places.
Step 4 of 7 :
Construct the 98% confidence interval for the slope. Round your
answers to three decimal places.
Lower and upper end point:
Step 5 of 7 :
Construct the 95% confidence interval for the slope. Round your
answers to...
Step 2 of 7 :
Calculate the estimated variance of errors, s2e. Round your
answer to three decimal places.
Step 3 of 7 :
Calculate the estimated variance of slope, s2b1. Round your
answer to three decimal places.
Step 4 of 7 :
Construct the 98% confidence interval for the slope. Round your
answers to three decimal places.
Lower and upper end point:
Step 5 of 7 :
Construct the 95% confidence interval for the slope. Round your
answers to...
 The data in the table is the number of absences for 7 students and their corresponding grade Number of Absences 11 2 2 3 3 7 Grade 4|3.7 | 3.5 I 27 I 2.4 | 1.7|1.7 Step 5 of 5 : Construct the 99 % confidence interval for the slope. Round your answers to three decimal places Previous Answers b -0.3607 bo 3.7933 Lower endpoint Upper endpoint SSE 2021 20.404 0016
 Step 1 of 7 :
Calculate the sum of squared errors (SSE). Use the values above.
Round your answer to three decimal places.
Step 2 of 7 :
Calculate the estimated variance of errors, s2e. Round your
answer to three decimal places.
Step 3 of 7 :
Calculate the estimated variance of slope, s2b1. Round your
answer to three decimal places.
Step 4 of 7 :
Construct the 98% confidence interval for the slope. Round your
answers to three decimal...
Step 1 of 7 :
Calculate the sum of squared errors (SSE). Use the values above.
Round your answer to three decimal places.
Step 2 of 7 :
Calculate the estimated variance of errors, s2e. Round your
answer to three decimal places.
Step 3 of 7 :
Calculate the estimated variance of slope, s2b1. Round your
answer to three decimal places.
Step 4 of 7 :
Construct the 98% confidence interval for the slope. Round your
answers to three decimal...
Most questions answered within 3 hours.
-
Luther Corporation
Consolidated Balance Sheet
December 31, 2019 and 2018 (in $ millions)
Assets
2019
2018...
asked 25 seconds from now -
(Expected rate of return and risk) Carter Inc. is evaluating a
security. Calculate the investment’s expected...
asked 2 hours ago -
What specific indicators can point to lack of progress for
African Americans in American society?
asked 3 hours ago -
1-The Electrons in a beam are moving at 2.7×10⁸ m/s in an
electric field of 15000...
asked 3 hours ago -
A gas tank is a vertical cylinder. It has a radius of 1m, a
height of...
asked 4 hours ago -
Accent Software faces the following conditions. All of these
support Accent’s use of a market-penetration pricing...
asked 5 hours ago -
A mathematically inclined friend emails you the following
instructions: "Meet me in the cafeteria the first...
asked 5 hours ago -
A monopoly sells in two countries . The demand curves in the two
countries are p1...
asked 6 hours ago -
A .15kg rubber ball is bounced off a wall. Before hitting the
wall, the ball moves...
asked 7 hours ago -
A manufacturing company preparing to build a new plant is
considering three potential locations for it....
asked 7 hours ago -
B. If compound Y has approximately the same values of solubility
in toluene as compound X,...
asked 7 hours ago -
Oscar Inc. has inventory in Japan valued at 39,051,000 Yen one
year ago. One year ago...
asked 7 hours ago