
Homework Answers
Solution:-
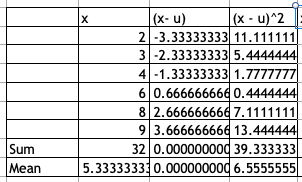
1) Mean = 5.33

2) Variance is 7.8667

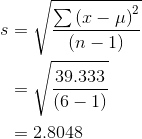
3) Standard deviation is 2.8048.
Data Set: 6, 1, 4, 2, 3, 4, 6, 8, 9 a. Calculate the mean, median,...
Data Set: 6, 1, 4, 2, 3, 4, 6, 8, 9 a. Calculate the mean, median, mode, range, variance and standard deviation (using either formula). b. Compare the two groups in terms of central tendency and variability. What conclusions can you draw from the data in regards to average number of time a student posted, variability of postings, etc?
9. What is the mean of the data set {0, 2, 4, 8, 16, 36} ?...
 9. What is the mean of the data set {0, 2, 4, 8, 16, 36} ? A 8.0 C 11.0 B 12.0 D 13.2
. For the following data set, X: 9, 6, 8, 3, 8, 9, 3, 4, 3,...
. For the following data set, X: 9, 6, 8, 3, 8, 9, 3, 4, 3, 7; VARIANCE = (Use one decimal point in your answer, e.g. 2.0)
What are the sample variance and sample standard deviation of the following data set: 4, 7,...
 What are the sample variance and sample standard deviation of the following data set: 4, 7, 9, 10, 16? Sample standard deviation=4.4 Variance=19.7 Sample standard deviation=6 Variance= 36 Sample standard deviation=7 Variance= 49 Sample standard deviation=3 Variance= 9
(2) Consider the sample: 9, 6. 7, 9, 10, 8 a) Find: the mean, the median,...
 (2) Consider the sample: 9, 6. 7, 9, 10, 8 a) Find: the mean, the median, the mode b) Find: the range, the quartiles Q1, Q3, the variance, the standard deviation c) Draw a box-plot for the given data set.
2. For the following data: 1 2 3 4 5 5 6 16 20 18 17...
 2. For the following data: 1 2 3 4 5 5 6 16 20 18 17 18 21 1. Calculate the sample mean and sample variance b. Calculate the probability that the population mean is between 9 and 10 if the population standard deviation is known to be 2.3. c. What is the 95% confidence interval for the population mean if the population standard deviation is known to be 2.32 d. Calculate the 95% confidence interval using the sample standard...
2. For the following data: 1 2 3 4 5 6 16 20 18 17 18...
 2. For the following data: 1 2 3 4 5 6 16 20 18 17 18 21 a. Calculate the sample mean and sample variance b. Calculate the probability that the population mean is between 9 and 10 if the population standard deviation is known to be 2.3. What is the 95% confidence interval for the population mean if the population standard deviation is known to be 2.3? d. Calculate the 95% confidence interval using the sample standard deviation. c.
For the following data: 1 2 3 4 5 6 16 20 18 17 18 21...
 For the following data: 1 2 3 4 5 6 16 20 18 17 18 21 a. Calculate the sample mean and sample variance b. Calculate the probability that the population mean is between 9 and 10 if the population standard deviation is known to be 2.3. What is the 95% confidence interval for the population mean if the population standard deviation is known to be 2.3? d. Calculate the 95% confidence interval using the sample standard deviation. c.
Find the mean, median, mode, population standard deviation and variance of the given data: Items 3...
 Find the mean, median, mode, population standard deviation and variance of the given data: Items 3 5 6 9 10 12 15 Frequency 1 4 2 12 5 4 2 Mean=9.03 Median= 9 Mode 9 Population standard= 4 Variance= 16 Mean=9,03 Median= 9 Mode- 9 Population standard deviation=5 Variance= 25 Mean=9.03 Median= 9 Mode= 9 Population standard deviation= 6 Variance= 36 Mean=9.03 Median= 9 Mode= 9 Population standard deviation=2.8 Variance= 7.7
For the following data set, X: 9, 6, 8, 3, 8, 9, 3, 4, 3, 7;...
For the following data set, X: 9, 6, 8, 3, 8, 9, 3, 4, 3, 7; MEAN = (Use one decimal point in your answer, e.g. 2.0)
 9. What is the mean of the data set {0, 2, 4, 8, 16, 36} ? A 8.0 C 11.0 B 12.0 D 13.2
 What are the sample variance and sample standard deviation of the following data set: 4, 7, 9, 10, 16? Sample standard deviation=4.4 Variance=19.7 Sample standard deviation=6 Variance= 36 Sample standard deviation=7 Variance= 49 Sample standard deviation=3 Variance= 9
 (2) Consider the sample: 9, 6. 7, 9, 10, 8 a) Find: the mean, the median, the mode b) Find: the range, the quartiles Q1, Q3, the variance, the standard deviation c) Draw a box-plot for the given data set.
 2. For the following data: 1 2 3 4 5 5 6 16 20 18 17 18 21 1. Calculate the sample mean and sample variance b. Calculate the probability that the population mean is between 9 and 10 if the population standard deviation is known to be 2.3. c. What is the 95% confidence interval for the population mean if the population standard deviation is known to be 2.32 d. Calculate the 95% confidence interval using the sample standard...
 2. For the following data: 1 2 3 4 5 6 16 20 18 17 18 21 a. Calculate the sample mean and sample variance b. Calculate the probability that the population mean is between 9 and 10 if the population standard deviation is known to be 2.3. What is the 95% confidence interval for the population mean if the population standard deviation is known to be 2.3? d. Calculate the 95% confidence interval using the sample standard deviation. c.
 For the following data: 1 2 3 4 5 6 16 20 18 17 18 21 a. Calculate the sample mean and sample variance b. Calculate the probability that the population mean is between 9 and 10 if the population standard deviation is known to be 2.3. What is the 95% confidence interval for the population mean if the population standard deviation is known to be 2.3? d. Calculate the 95% confidence interval using the sample standard deviation. c.
 Find the mean, median, mode, population standard deviation and variance of the given data: Items 3 5 6 9 10 12 15 Frequency 1 4 2 12 5 4 2 Mean=9.03 Median= 9 Mode 9 Population standard= 4 Variance= 16 Mean=9,03 Median= 9 Mode- 9 Population standard deviation=5 Variance= 25 Mean=9.03 Median= 9 Mode= 9 Population standard deviation= 6 Variance= 36 Mean=9.03 Median= 9 Mode= 9 Population standard deviation=2.8 Variance= 7.7
Most questions answered within 3 hours.
-
1,1-dimethylcyclorohexane reacts with single bromine atom
asked 25 seconds from now -
A 0.0510 M solution of an organic acid has an
[H+] of 7.50×10⁻⁴M .
What is...
asked 3 minutes ago -
The completed Lewis structure of CO2 contains a total
of 0,1,2,3,4,5,6,7,8 covalent bonds
and 0,1,2,3,4,5,6,7,8 lone pairs.
NOTE:...
asked 5 minutes ago -
what is the profit-maximizing output condition that a
monopolistically competitive firm must satisfy? a) price charged...
asked 7 minutes ago -
Consider the set of ordered pairs shown below. Assuming that the
regression equation is y=3.513+0.429x and...
asked 28 minutes ago -
1. (A) Write two
structural (constitutional)
isomers of C4H8F2?
Please show all of
the
asked 31 minutes ago -
Objective: Practice converting a Boolean logic
expression into it’s truth table and to show the implementation...
asked 28 minutes ago -
1) Name the three holes located in the greater wing of the
sphenoid bone in order...
asked 31 minutes ago -
For the following reaction set-up, which type of hydrocarbon
product would form? 1,4-hexadiene + two Cl2...
asked 34 minutes ago -
Consider the following method that is intended to determine if
the double values d1 and d2...
asked 46 minutes ago -
could someone please post clear drawings of the three structures
in the equilibrium mixture of D-glucose...
asked 53 minutes ago -
Using the Properties of Order show that 5n5 +
4n4 + 6n3 + 2n2+ n +...
asked 56 minutes ago