Using the table below, conduct a test to determine whether the proportion of children with frequent...
Using the table below, conduct a test to determine whether the proportion of children with frequent ear infections in non-smoking households is different than 50%. What is the appropriate p-value?
|
Non-smoking household |
Smoking household |
|
|
Infrequent ear infections |
69 |
22 |
|
Frequent ear infections |
45 |
29 |
|
p = 0.04 |
||
|
p = 0.02 |
||
|
p = 0.01 |
||
|
p = 0.33 |
Homework Answers
Let "p" be the proportion of children with frequent ear infections in non-smoking households.
In a random sample of n=114 individuals 45 have Frequent ear infections.
Therefore, 
We wan to test the claim that the proportion of children with frequent ear infections in non-smoking households is different than 50%.
The hypothesis testing problem is:

the test statistic is:


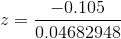


The p-value is
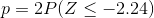
 ### By using z table: P(z<=-2.24)=0.0125

More accurately by using Excel: p=0.024
=2*NORMDIST(-2.242,0,1,1)
Therefore the correct choice is p=0.02
Add Answer to:
Using the table below,
conduct a test to determine whether the proportion of children with
frequent...
Use α = 0.01 and conduct a goodness of fit test using 5 classes to see...
Use α = 0.01 and conduct a goodness of fit test using 5 classes to see whether the following sample appears to have been selected from a normal probability distribution. (Note: x = 70 and s = 18.) 55 86 94 58 55 95 55 52 69 95 90 65 87 50 56 55 57 98 58 79 92 62 59 88 40 Find the value of the test statistic. Find the p-value. (Round your answer to four decimal places.)...
In order to conduct a hypothesis test for the population proportion, you sample 320 observations that...
 In order to conduct a hypothesis test for the population proportion, you sample 320 observations that result in 128 successes.(You may find it useful to reference the appropriate table: z table or t table HO pz 0.45; HA: p < 0.45. a-1. Calculate the value of the test statistic. (Negative value should be indicated by a minus sign. Round intermediate calculations to at least 4 decimal places and final answer to 2 decimal places.) est statistic a-2. Find the p-value....
Use α-0.01 and conduct a goodness of t test using 5 classes to see whether the...
 Use α-0.01 and conduct a goodness of t test using 5 classes to see whether the following sample appears to have been selected rom a normal probability distribution. Note x 702 and s 55 | 86 94 | 58 55 95 55 2 69 | 95 | 90 65 87 50 56 5557 98 58 79 92 62 5988 45 State thenll and aleative hypotheses. Ho: The population has a normal probability distribution. Ha: The population has a sampling mean...
Exercise 9-59 Algo In order to conduct a hypothesis test for the population proportion, you sample...
 Exercise 9-59 Algo In order to conduct a hypothesis test for the population proportion, you sample 400 observations that result in 212 successes. (You may find it useful to reference the appropriate table: z table or table) He: p > 0.54; HA: P < 0.54 a-1. Calculate the value of the test statistic. (Negative value should be indicated by a minus sign. Round intermediate calculations to at least 4 decimal places and final answer to 2 decimal places.) Test statistic...
Using the accompanying data below, perform a chi-square test using alphaαequals=0.01 to determine if the proportion...
Using the accompanying data below, perform a chi-square test using alphaαequals=0.01 to determine if the proportion of "Yes" observations differs between Populations A and B. Observed frequencies: Population Yes No A 18 20 B 22 20 Expected frequencies: Population Yes No A 19 19 B 21 21 Click the icon to view an excerpt from the table of chi-square critical values. What are the null and alternative hypotheses? A. Upper H 0H0: p Subscript Upper A Baseline not equals p...
Question completion Status: Blackboard Help QUESTION 3 Using the data below, test whether education and smoking...
 Question completion Status: Blackboard Help QUESTION 3 Using the data below, test whether education and smoking status are independent. Run the test at a 5% level of significance. Give each of the following to receive full credit: 1) the appropriate null and alternative hypotheses; 2) the appropriate test; 3) the decision rule; 4) the calculation of the test statistic and 5) your conclusion including a comparison to alpha or the critical value. You MUST show your work to receive full...
Im using SPSS to test whether the researchers’ predictions are true and to determine the proportion...
Im using SPSS to test whether the researchers’ predictions are true and to determine the proportion of cholesterol concentration that is explained by time watching TV. but I dont know what test to run. please help DATA is below Case Number 1 2 3 4 5 6 7 8 9 10 11 12 13 14 15 16 17 18 19 20 21 22 23 24 25 26 27 28 29 30 31 32 33 34 35 36 37 38 39...
7) A study examined language acquisition in learning-impaired children. The reseateno designed two computer modules that taught the same content but instructional approaches. The study refers to...
 7) A study examined language acquisition in learning-impaired children. The reseateno designed two computer modules that taught the same content but instructional approaches. The study refers to the two computer module used different s as Module 1" and Module 2. " Children at each module, students took a quiz that asked the children to identify 50 of correct identifications by the 22 children in the Module identifications by the 22 children in the Module 2 group were summarized in the...
answer 10 please. 10. Using the results of #8 and #9, test the claim that females...
 answer 10 please.
10. Using the results of #8 and #9, test the claim that females have a higher proportion of cat ownership than males. a. State the null and alternative b. State the test statistic c. Use the p-value to make a decision (reject or fail to reject) d. Graph the test statistic, p-value, and a=0.05 e. Write your conclusion in terms of the problem 8 OwnLAT Yes res hypothesis. The rejection regia falls on the two otention of...
answer 10 please.
10. Using the results of #8 and #9, test the claim that females have a higher proportion of cat ownership than males. a. State the null and alternative b. State the test statistic c. Use the p-value to make a decision (reject or fail to reject) d. Graph the test statistic, p-value, and a=0.05 e. Write your conclusion in terms of the problem 8 OwnLAT Yes res hypothesis. The rejection regia falls on the two otention of...
Question 7b - Conduct a Hypothesis Test to determine if there is evidence that the proportion of accounts with Good quality rating is less than 26%. Use significance level alpha=5%. Test Statistic = _...
 Question 7b - Conduct a Hypothesis Test to determine if there is
evidence that the proportion of accounts with Good quality rating
is less than 26%. Use significance level alpha=5%.
Test Statistic = _________
P value = ___________
377 1 96·33 199 2 98 72 27 98 006 014 717 002 86 997 87 3 7 4 996 7 9 le le le le rede-le Ex Ex Ex Ex Ex Ex Ex Ex ee le le le le en Ma...
Question 7b - Conduct a Hypothesis Test to determine if there is
evidence that the proportion of accounts with Good quality rating
is less than 26%. Use significance level alpha=5%.
Test Statistic = _________
P value = ___________
377 1 96·33 199 2 98 72 27 98 006 014 717 002 86 997 87 3 7 4 996 7 9 le le le le rede-le Ex Ex Ex Ex Ex Ex Ex Ex ee le le le le en Ma...
 In order to conduct a hypothesis test for the population proportion, you sample 320 observations that result in 128 successes.(You may find it useful to reference the appropriate table: z table or t table HO pz 0.45; HA: p < 0.45. a-1. Calculate the value of the test statistic. (Negative value should be indicated by a minus sign. Round intermediate calculations to at least 4 decimal places and final answer to 2 decimal places.) est statistic a-2. Find the p-value....
 Use α-0.01 and conduct a goodness of t test using 5 classes to see whether the following sample appears to have been selected rom a normal probability distribution. Note x 702 and s 55 | 86 94 | 58 55 95 55 2 69 | 95 | 90 65 87 50 56 5557 98 58 79 92 62 5988 45 State thenll and aleative hypotheses. Ho: The population has a normal probability distribution. Ha: The population has a sampling mean...
 Exercise 9-59 Algo In order to conduct a hypothesis test for the population proportion, you sample 400 observations that result in 212 successes. (You may find it useful to reference the appropriate table: z table or table) He: p > 0.54; HA: P < 0.54 a-1. Calculate the value of the test statistic. (Negative value should be indicated by a minus sign. Round intermediate calculations to at least 4 decimal places and final answer to 2 decimal places.) Test statistic...
 Question completion Status: Blackboard Help QUESTION 3 Using the data below, test whether education and smoking status are independent. Run the test at a 5% level of significance. Give each of the following to receive full credit: 1) the appropriate null and alternative hypotheses; 2) the appropriate test; 3) the decision rule; 4) the calculation of the test statistic and 5) your conclusion including a comparison to alpha or the critical value. You MUST show your work to receive full...
 7) A study examined language acquisition in learning-impaired children. The reseateno designed two computer modules that taught the same content but instructional approaches. The study refers to the two computer module used different s as Module 1" and Module 2. " Children at each module, students took a quiz that asked the children to identify 50 of correct identifications by the 22 children in the Module identifications by the 22 children in the Module 2 group were summarized in the...
 answer 10 please.
10. Using the results of #8 and #9, test the claim that females have a higher proportion of cat ownership than males. a. State the null and alternative b. State the test statistic c. Use the p-value to make a decision (reject or fail to reject) d. Graph the test statistic, p-value, and a=0.05 e. Write your conclusion in terms of the problem 8 OwnLAT Yes res hypothesis. The rejection regia falls on the two otention of...
answer 10 please.
10. Using the results of #8 and #9, test the claim that females have a higher proportion of cat ownership than males. a. State the null and alternative b. State the test statistic c. Use the p-value to make a decision (reject or fail to reject) d. Graph the test statistic, p-value, and a=0.05 e. Write your conclusion in terms of the problem 8 OwnLAT Yes res hypothesis. The rejection regia falls on the two otention of...
 Question 7b - Conduct a Hypothesis Test to determine if there is
evidence that the proportion of accounts with Good quality rating
is less than 26%. Use significance level alpha=5%.
Test Statistic = _________
P value = ___________
377 1 96·33 199 2 98 72 27 98 006 014 717 002 86 997 87 3 7 4 996 7 9 le le le le rede-le Ex Ex Ex Ex Ex Ex Ex Ex ee le le le le en Ma...
Question 7b - Conduct a Hypothesis Test to determine if there is
evidence that the proportion of accounts with Good quality rating
is less than 26%. Use significance level alpha=5%.
Test Statistic = _________
P value = ___________
377 1 96·33 199 2 98 72 27 98 006 014 717 002 86 997 87 3 7 4 996 7 9 le le le le rede-le Ex Ex Ex Ex Ex Ex Ex Ex ee le le le le en Ma...
Most questions answered within 3 hours.
-
Is pursuit of a single-payer system the solution to workforce
challenges? Why or why not? What...
asked 1 minute ago -
Consider this code below. If this is correct, explain how it
works. If it is not...
asked 3 minutes ago -
a rock is sliding down a hill. Assume that the hill is 20 meters
high and...
asked 3 minutes ago -
At a point high in the Earth's atmosphere, He2+ ions in a
concentration of 2.7×10¹²/m3 are...
asked 3 minutes ago -
You’ve observed the following returns on Yamauchi Corporation’s
stock over the past five years: –28.8 percent,...
asked 4 minutes ago -
Given the pKa values of Lysine (2.2, 9.0 and 10.5), what is
the net charge of...
asked 10 minutes ago -
Which of the following descriptions of correlation is
correct?
Group of answer choices
a) Correlation equals...
asked 12 minutes ago -
Which of the following answers complete the sentence
correctly?
The pyruvate dehydrogenase complex is activated by:...
asked 12 minutes ago -
On the first day of the fiscal year, a company issues a
$920,000, 9%, 5-year bond...
asked 19 minutes ago -
Compute the illumination at the edge of a circular table of
radius of 1 m, if...
asked 20 minutes ago -
A 66 kg water skier is being accelerated by a ski boat on a flat
("glassy")...
asked 20 minutes ago -
Recently I purchased a second vehicle for our family. The
vehicle we had was too small...
asked 28 minutes ago