Conc Ratio Temp Time Rating 2 4 180 7 2.25 2 4 100 3 1.6 2...
| Conc | Ratio | Temp | Time | Rating |
| 2 | 4 | 180 | 7 | 2.25 |
| 2 | 4 | 100 | 3 | 1.6 |
| 2 | 13 | 140 | 1 | 3.1 |
| 4 | 7 | 140 | 3 | 4.8 |
| 4 | 10 | 180 | 3 | 4.5 |
| 4 | 10 | 160 | 5 | 4.6 |
| 4 | 13 | 100 | 7 | 4.3 |
| 4 | 1 | 180 | 7 | 1.8 |
| 4 | 1 | 100 | 1 | 1.3 |
| 4 | 1 | 100 | 1 | 1.4 |
| 4 | 1 | 100 | 1 | 1.45 |
| 5 | 4 | 160 | 7 | 4.5 |
| 5 | 1 | 100 | 7 | 1.4 |
| 5 | 4 | 100 | 1 | 1.7 |
| 5 | 13 | 140 | 1 | 4.5 |
| 6 | 7 | 120 | 7 | 4.7 |
| 6 | 13 | 180 | 7 | 4.7 |
| 6 | 1 | 160 | 1 | 1.5 |
| 7 | 4 | 180 | 1 | 4.6 |
| 7 | 4 | 180 | 5 | 4.6 |
| 7 | 7 | 180 | 1 | 4.75 |
| 7 | 13 | 140 | 1 | 4.6 |
| 7 | 1 | 120 | 7 | 2.5 |
| 7 | 10 | 100 | 7 | 4.6 |
| 8 | 4 | 100 | 1 | 1.4 |
| 8 | 10 | 140 | 3 | 4.7 |
| 8 | 13 | 140 | 1 | 4.6 |
| 8 | 1 | 160 | 7 | 2 |
| 10 | 7 | 120 | 5 | 4.9 |
| 10 | 13 | 180 | 3 | 4.8 |
| 10 | 10 | 120 | 7 | 4.9 |
| 10 | 1 | 180 | 1 | 2.6 |
| In SPSS Estimate a multiple regression model that could be used to predict the wrinkle resistance rating | |||||||||
| of cotton cloth given data on the four predictor variables. | |||||||||
| Test for the statistical significance of each predictor variable at the 0.05 level of significance testing | |||||||||
| What is the percentage variation in wrinkle resistance rating that is explained by the model you | |||||||||
| estimated? | |||||||||
Type or paste question here
Homework Answers
Solution:
The SPSS output for multiple regression is:
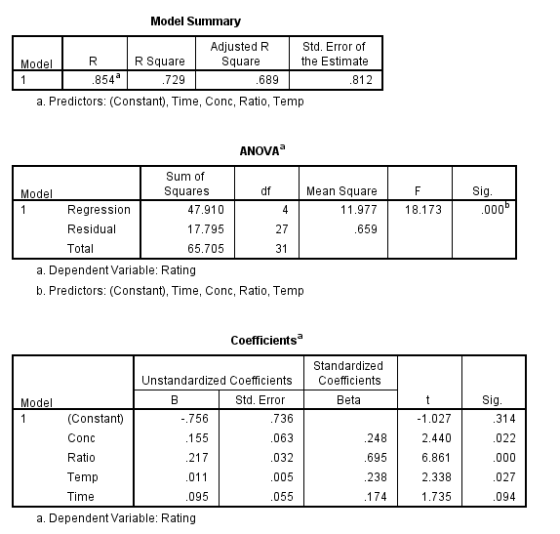
The multiple regression equation is:

Test for the statistical significance of each predictor variable at the 0.05 level of significance testing
Answer:
Conc: Since the p-value for the Conc coefficient is 0.022 which is less than the level of significance 0.05, indicating, the Conc variable is significant.
Ratio: Since the p-value for the Ratio coefficient is 0.000 which is less than the level of significance 0.05, indicating, the Ratio variable is significant.
Temp: Since the p-value for the Temp coefficient is 0.027 which is less than the level of significance 0.05, indicating, the Temp variable is significant.
Time: Since the p-value for the Time coefficient is 0.094 which is greater than the level of significance 0.05, indicating, the Time variable is not significant.
What is the percentage variation in wrinkle resistance rating that is explained by the model you estimated?
Answer: The R-square value is 0.729, therefore, 72.9% variation in wrinkle resistance rating is explained by the estimated model.
please don't copy. thanks Question 3. In a study measuring the height of birch trees, two...
 please don't copy. thanks
Question 3. In a study measuring the height of birch trees, two types of fertilizer were used. Prior to the study 14 tree's heights were measured. 8 trees were then selected at random to receive a liquid fertilizer during the first summer of the experiment. At the end of the first year their growth was measured. While this was occurring another 6 trees were receiving a granular fertilizer. At the end first year their height was...
please don't copy. thanks
Question 3. In a study measuring the height of birch trees, two types of fertilizer were used. Prior to the study 14 tree's heights were measured. 8 trees were then selected at random to receive a liquid fertilizer during the first summer of the experiment. At the end of the first year their growth was measured. While this was occurring another 6 trees were receiving a granular fertilizer. At the end first year their height was...
Draw a structure that is consistent with the MS, IR, and NMR spectra in Figures 1-3....
 Draw a structure that is consistent with the MS, IR, and NMR spectra in Figures 1-3. abundance اسلام سال M 73 10' 20' 30' 40'50' 60' 70' 80' 90 '100' 110' 120 130 140 150 160 m/z 25 3.5 4 4.5 wavelength (mm) 5 5.5 6 7 8 9 10 11 12 13 14 15 16 ECZO-EESZOW 4000 3500 3000 2500 1400 1200 1000 800 600 2000 1800 1600 wavenumber (cm) wavenumber (cm" 100 80 200 180 160 140 120...
Q7). Let y,,y.., y represent the life time for the computer chips that are exponentially distributed with pdf e^ for else (a). Derive the likelihood ratio test for testing Ho: λ A, versus Ha:...
 Q7). Let y,,y.., y represent the life time for the computer chips that are exponentially distributed with pdf e^ for else (a). Derive the likelihood ratio test for testing Ho: λ A, versus Ha: λ> λ (b). If a random sample of life times for the computer chips are 4 years, 5 years, 7 years, 6 years, 7 years, Use α-005 does this sample support the fact that λ > 4.5 years ?. 4.6, 4.7, 4.8, 4.9, 5.0 Compute the...
3 2 4 180 40 160 140 120 100 PPM 60 OH C Match the numbered...
 3 2 4 180 40 160 140 120 100 PPM 60 OH C Match the numbered peaks in the NMR spectrum corresponding to the labeled carbon atoms. A 4 B 3 C 2 Tries 0/1 Submit Answer 20 30
DESCRIBE PEAKS OF EACH NMR (Carbon 13 and PROTON 1H) and mass spec on the one page NMR Unknown_18 200 180 160 140 120...
 DESCRIBE PEAKS OF EACH NMR (Carbon 13 and PROTON 1H) and mass
spec on the one page
NMR Unknown_18 200 180 160 140 120 80 60 40 20 0 100 pom - 2 2 4 3 11 10 9 8 7 6 4 3 2 1 0 5 ppm - Relative Intensity 25 50 75 100 125 150 m/z
DESCRIBE PEAKS OF EACH NMR (Carbon 13 and PROTON 1H) and mass
spec on the one page
NMR Unknown_18 200 180 160 140 120 80 60 40 20 0 100 pom - 2 2 4 3 11 10 9 8 7 6 4 3 2 1 0 5 ppm - Relative Intensity 25 50 75 100 125 150 m/z
AFC $300 150 100 75 AVC $100 75 70 73 T Outpuit 1 2 3 4...
 AFC $300 150 100 75 AVC $100 75 70 73 T Outpuit 1 2 3 4 5 6 7 8 9 10 60 80 ATC $400 225 170 148 140 140 146 156 171 190 MC $100 50 60 80 110 140 180 230 290 360 90 50 43 103 38 33 30 119 138 160 The accompanying table shows cost data for a firm that is selling in a purely competitive market. If the market price for the firm's...
Check 200 180 160 120 80 60 40 20 0 140 a 100 ppm s, 3H t, 3 H d. 2 a. 2 H d. 2H s, 1 H 1 10 9 8 7 6 4 3 2 1 5 ppm 1) W...
 Check 200 180 160 120 80 60 40 20 0 140 a 100 ppm s, 3H t, 3 H d. 2 a. 2 H d. 2H s, 1 H 1 10 9 8 7 6 4 3 2 1 5 ppm 1) Which compound gives the following spectra? For the 'H-NMR assign all signals. Interpret mol peak and base peak in the mass spectrum if a mole peak exists. Assign at least two 13C signals, How does the IR spectrum...
Observations (minutes per cycle) Element Rating 1 2 3 4 5 6 7 1 100% 2.0...
Observations (minutes per cycle) Element Rating 1 2 3 4 5 6 7 1 100% 2.0 1.9 1.8 2.1 2.0 2.2 1.8 2 110% 7.5 7.7 7.2 7.5 8.2 7.4 7.0 3 110% 3.4 4.7 3.7 4.4 3.3 3.5 3.6 4 90% 10.3 11.3 12.7 10.1 12.2 12.1 10.2 Assuming a 25% allowance factor for the process, find the standard time for this process
QUESTION 7 The data set Beer Large, which can be found in StatCrunch Shared Data Sets,...
 QUESTION 7 The data set Beer Large, which can be found in StatCrunch Shared Data Sets, gives the Alcohol, Carbohydrates and Calories for different brands of beer. The explanatory variable is x + Carbohydrates and the response variable is Y - Calories. Use this information to answer: Calculate the correlation between carbohydrates and calories. (4 decimal places) Row vars varo var var 8 var9 var 10 2 الميا ABV 4.1 5.4 4.43 4.13 5.9 4.9 Carbs 2.6 13.7 5.8 5...
Step 2- Synthesis of 3-nitrobenzoate 11.5 110 10.5 100 200 850 75 7 65 60 550...
 Step 2- Synthesis of 3-nitrobenzoate 11.5 110 10.5 100 200 850 75 7 65 60 550 45 40 35 30 25 2015 tipp 30 220 210 200 180 180 170 160 150 140 130 120 110 100 f1 pm % 80 70 60 50 30 20 100 -10
 please don't copy. thanks
Question 3. In a study measuring the height of birch trees, two types of fertilizer were used. Prior to the study 14 tree's heights were measured. 8 trees were then selected at random to receive a liquid fertilizer during the first summer of the experiment. At the end of the first year their growth was measured. While this was occurring another 6 trees were receiving a granular fertilizer. At the end first year their height was...
please don't copy. thanks
Question 3. In a study measuring the height of birch trees, two types of fertilizer were used. Prior to the study 14 tree's heights were measured. 8 trees were then selected at random to receive a liquid fertilizer during the first summer of the experiment. At the end of the first year their growth was measured. While this was occurring another 6 trees were receiving a granular fertilizer. At the end first year their height was...
 Draw a structure that is consistent with the MS, IR, and NMR spectra in Figures 1-3. abundance اسلام سال M 73 10' 20' 30' 40'50' 60' 70' 80' 90 '100' 110' 120 130 140 150 160 m/z 25 3.5 4 4.5 wavelength (mm) 5 5.5 6 7 8 9 10 11 12 13 14 15 16 ECZO-EESZOW 4000 3500 3000 2500 1400 1200 1000 800 600 2000 1800 1600 wavenumber (cm) wavenumber (cm" 100 80 200 180 160 140 120...
 Q7). Let y,,y.., y represent the life time for the computer chips that are exponentially distributed with pdf e^ for else (a). Derive the likelihood ratio test for testing Ho: λ A, versus Ha: λ> λ (b). If a random sample of life times for the computer chips are 4 years, 5 years, 7 years, 6 years, 7 years, Use α-005 does this sample support the fact that λ > 4.5 years ?. 4.6, 4.7, 4.8, 4.9, 5.0 Compute the...
 3 2 4 180 40 160 140 120 100 PPM 60 OH C Match the numbered peaks in the NMR spectrum corresponding to the labeled carbon atoms. A 4 B 3 C 2 Tries 0/1 Submit Answer 20 30
 DESCRIBE PEAKS OF EACH NMR (Carbon 13 and PROTON 1H) and mass
spec on the one page
NMR Unknown_18 200 180 160 140 120 80 60 40 20 0 100 pom - 2 2 4 3 11 10 9 8 7 6 4 3 2 1 0 5 ppm - Relative Intensity 25 50 75 100 125 150 m/z
DESCRIBE PEAKS OF EACH NMR (Carbon 13 and PROTON 1H) and mass
spec on the one page
NMR Unknown_18 200 180 160 140 120 80 60 40 20 0 100 pom - 2 2 4 3 11 10 9 8 7 6 4 3 2 1 0 5 ppm - Relative Intensity 25 50 75 100 125 150 m/z
 AFC $300 150 100 75 AVC $100 75 70 73 T Outpuit 1 2 3 4 5 6 7 8 9 10 60 80 ATC $400 225 170 148 140 140 146 156 171 190 MC $100 50 60 80 110 140 180 230 290 360 90 50 43 103 38 33 30 119 138 160 The accompanying table shows cost data for a firm that is selling in a purely competitive market. If the market price for the firm's...
 Check 200 180 160 120 80 60 40 20 0 140 a 100 ppm s, 3H t, 3 H d. 2 a. 2 H d. 2H s, 1 H 1 10 9 8 7 6 4 3 2 1 5 ppm 1) Which compound gives the following spectra? For the 'H-NMR assign all signals. Interpret mol peak and base peak in the mass spectrum if a mole peak exists. Assign at least two 13C signals, How does the IR spectrum...
 QUESTION 7 The data set Beer Large, which can be found in StatCrunch Shared Data Sets, gives the Alcohol, Carbohydrates and Calories for different brands of beer. The explanatory variable is x + Carbohydrates and the response variable is Y - Calories. Use this information to answer: Calculate the correlation between carbohydrates and calories. (4 decimal places) Row vars varo var var 8 var9 var 10 2 الميا ABV 4.1 5.4 4.43 4.13 5.9 4.9 Carbs 2.6 13.7 5.8 5...
 Step 2- Synthesis of 3-nitrobenzoate 11.5 110 10.5 100 200 850 75 7 65 60 550 45 40 35 30 25 2015 tipp 30 220 210 200 180 180 170 160 150 140 130 120 110 100 f1 pm % 80 70 60 50 30 20 100 -10
Most questions answered within 3 hours.
-
A sample of size 31 will be drawn from a population with mean 39
and standard...
asked 4 minutes ago -
What is the effect on the P-value when a test is changed from a
two-tailed hypothesis...
asked 8 minutes ago -
I wish to estimate µ, the mean of a population. After I collect
and an-
alyze...
asked 37 minutes ago -
At a local university, you poll a group of 115 students and find
that 37 of...
asked 18 minutes ago -
Gladstone company tracks the number of units purchased and sold
throughout each accounting period but applies...
asked 21 minutes ago -
When determining if a molecule's configuration is E or Z, what
determines the higher priority groups?
asked 25 minutes ago -
13. What is the amount
of conversion cost transferred to finished goods? (Round
your intermediate calculations...
asked 27 minutes ago -
Sulfuric Acid is a "strong" acid, but only releases a single
proton when it dissolves. What...
asked 27 minutes ago -
The
second floor of a house is 6 m above the street level. How much
work...
asked 29 minutes ago -
What uncontrollable factor(s) contributed to Hong Kong Disney’s
poor performance during its first year?
asked 30 minutes ago -
You are interested in whether students that have a male
instructors perform differently on exams. To...
asked 43 minutes ago -
Discuss the following: The policies that promote economic
growth. Why are some countries more developed than...
asked 38 minutes ago