The purpose of this analysis is to find an intrinsic value for Microsoft (MSFT) using the...
The purpose of this analysis is to find an intrinsic value for Microsoft (MSFT) using the both the Constant Dividend Discount Model (DDM) and the Non-constant DDM. You will need to (1) estimate Beta in order to calculate the required return for MSFT; (2) estimate dividend growth rate; and (3) estimate future dividends.
Submit your Excel spreadsheet with all data and formulas so that your answers can be replicated. You may answer the questions on the spreadsheet. HOWEVER, WRAP YOUR TEXT!!! I do NOTwant to see text running across 40 columns.Remember, Excel is not a word processor. Do a simple draft print to see if your output is in readable form. Follow instructions as written. NEATNESS AND ORGANIZATION MATTERS!
- You are analyzing Microsoft to find an intrinsic value for Microsoft (MSFT) using the both the Constant Dividend Discount Model (DDM) and the Non-constant DDM. I have provided you with an Excel spreadsheet of monthly prices (121 months)from December 1, 2008 to December 1, 2018). These prices have already been adjusted for dividends. List dates and prices out on your spreadsheet in order to calculate 120 monthly returns.
2. Using the prices provided, calculate the monthly returns for each of the stocks, where r = (Pt/Pt-1) – 1; which is the same as [(Pt-Pt-1)/ Pt-1] as I covered in the Lecture Video. PLEASE NOTE THAT THE DATA IS LISTED FROM DEC 2008 TO DEC 2018! SO BE CAREFUL WITH YOUR RETURN FORMULA!There are 121 months to calculate 120 monthly returns. You may post monthly returns as (1) decimals to 6 placesor as (2) percentages to 4 places. For example, average return for MSFT shouldbe written as .009999 or .9999%.
(10 points)
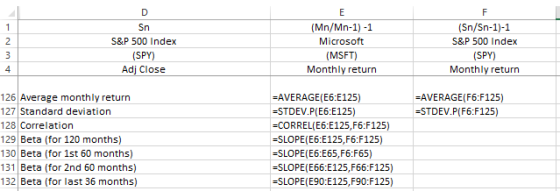
- At the bottom of the column for each stock calculate the Average Monthly Return [use =AVERAGE() function], and for the Standard Deviation [use =STDEV.P()] population function NOTSTDEV() sample function).
As a check, you should find your average returns to be: MSFT = 1.7997% and SPY = 1.1048%.
(5 points)
- CALCULATEand INTERPRETthe Correlation Coefficient (r1,2) between the RETURNS(not Prices) of Microsoft (MSFT) and S&P 500 Market Portfolio Index (SPY) => [use the =CORREL() function]. (5 points)
- We can estimate the Beta for MSFT over the n-monthly periods by running a Regression of SPY returnson the x-axis (independent variable) and MSFT returnson the y-axis (dependent variable). The Beta is the SLOPEof the regression. To find Beta use the =SLOPE(MSFT, SPY) functionin Excel. Be carefuluse RETURNS NOT prices! NOTE: You may round your Beta estimates to 2-decimalsfor comparison to Yahoo& Value Line.
Calculate the beta for each period:
(a) Estimate Beta over the full 120 monthly returns (10 years): Months 1 - 120
(b) Estimate Beta over the first 60 monthly returns (5 years): Months 1 - 60
(c) Estimate Beta over the second 60 monthly returns (5 years): Months 61 – 120
(d) Estimate Beta over the last 36 monthly returns (3 years): Months 85 – 120
(10 points)
- define Beta; give a good explanation of what Beta represents (see Module 2). (5 points)
| Microsoft | S&P 500 Index | ||
| (MSFT) | (SPY) | ||
| Obs. | Date | Adj Close | Adj Close |
| 1 | 12/1/08 | 15.171647 | 72.986816 |
| 2 | 1/1/09 | 13.345434 | 67.537422 |
| 3 | 2/1/09 | 12.604017 | 60.280582 |
| 4 | 3/1/09 | 14.434885 | 64.838524 |
| 5 | 4/1/09 | 15.920021 | 71.790146 |
| 6 | 5/1/09 | 16.415056 | 75.986549 |
| 7 | 6/1/09 | 18.796745 | 75.510246 |
| 8 | 7/1/09 | 18.599051 | 81.602089 |
| 9 | 8/1/09 | 19.492626 | 84.616447 |
| 10 | 9/1/09 | 20.453114 | 87.201355 |
| 11 | 10/1/09 | 22.051516 | 85.932243 |
| 12 | 11/1/09 | 23.387495 | 91.226288 |
| 13 | 12/1/09 | 24.345514 | 92.470947 |
| 14 | 1/1/10 | 22.508421 | 89.590057 |
| 15 | 2/1/10 | 22.899803 | 92.384804 |
| 16 | 3/1/10 | 23.504421 | 97.607178 |
| 17 | 4/1/10 | 24.507513 | 99.525345 |
| 18 | 5/1/10 | 20.703796 | 91.617607 |
| 19 | 6/1/10 | 18.54821 | 86.465836 |
| 20 | 7/1/10 | 20.805275 | 92.81102 |
| 21 | 8/1/10 | 18.919022 | 88.636307 |
| 22 | 9/1/10 | 19.846544 | 96.059845 |
| 23 | 10/1/10 | 21.613195 | 100.263435 |
| 24 | 11/1/10 | 20.470543 | 100.263435 |
| 25 | 12/1/10 | 22.757057 | 106.40667 |
| 26 | 1/1/11 | 22.610296 | 109.458611 |
| 27 | 2/1/11 | 21.672617 | 113.260925 |
| 28 | 3/1/11 | 20.824682 | 112.784561 |
| 29 | 4/1/11 | 21.259386 | 116.555138 |
| 30 | 5/1/11 | 20.513008 | 115.248009 |
| 31 | 6/1/11 | 21.464779 | 112.744888 |
| 32 | 7/1/11 | 22.620571 | 111.037201 |
| 33 | 8/1/11 | 21.960123 | 104.932869 |
| 34 | 9/1/11 | 20.678095 | 97.145752 |
| 35 | 10/1/11 | 22.123648 | 108.306389 |
| 36 | 11/1/11 | 21.251326 | 107.86628 |
| 37 | 12/1/11 | 21.729425 | 108.306389 |
| 38 | 1/1/12 | 24.717642 | 114.047813 |
| 39 | 2/1/12 | 26.567492 | 118.998093 |
| 40 | 3/1/12 | 27.180515 | 122.289597 |
| 41 | 4/1/12 | 26.978304 | 122.005577 |
| 42 | 5/1/12 | 24.593901 | 114.678444 |
| 43 | 6/1/12 | 25.942581 | 118.717079 |
| 44 | 7/1/12 | 24.992739 | 120.743851 |
| 45 | 8/1/12 | 26.137638 | 123.76886 |
| 46 | 9/1/12 | 25.405874 | 126.232666 |
| 47 | 10/1/12 | 24.364372 | 124.597 |
| 48 | 11/1/12 | 22.72529 | 125.302147 |
| 49 | 12/1/12 | 22.989487 | 125.531403 |
| 50 | 1/1/13 | 23.626413 | 132.893219 |
| 51 | 2/1/13 | 23.927656 | 134.588837 |
| 52 | 3/1/13 | 24.828709 | 139.080719 |
| 53 | 4/1/13 | 28.725281 | 142.38324 |
| 54 | 5/1/13 | 30.287378 | 145.744873 |
| 55 | 6/1/13 | 30.185152 | 143.043091 |
| 56 | 7/1/13 | 27.825571 | 151.23111 |
| 57 | 8/1/13 | 29.188885 | 146.695374 |
| 58 | 9/1/13 | 29.288961 | 150.603622 |
| 59 | 10/1/13 | 31.163521 | 158.345642 |
| 60 | 11/1/13 | 33.557331 | 163.038651 |
| 61 | 12/1/13 | 33.173367 | 166.362473 |
| 62 | 1/1/14 | 33.554665 | 161.370056 |
| 63 | 2/1/14 | 33.971455 | 168.71492 |
| 64 | 3/1/14 | 36.620502 | 169.36702 |
| 65 | 4/1/14 | 36.093391 | 171.296707 |
| 66 | 5/1/14 | 36.575829 | 175.271881 |
| 67 | 6/1/14 | 37.517635 | 178.037277 |
| 68 | 7/1/14 | 38.831207 | 176.486221 |
| 69 | 8/1/14 | 40.87352 | 183.451004 |
| 70 | 9/1/14 | 41.97076 | 180.078323 |
| 71 | 10/1/14 | 42.504902 | 185.181076 |
| 72 | 11/1/14 | 43.283485 | 190.268356 |
| 73 | 12/1/14 | 42.317471 | 188.743988 |
| 74 | 1/1/15 | 36.805725 | 184.162384 |
| 75 | 2/1/15 | 39.948784 | 194.513199 |
| 76 | 3/1/15 | 37.306213 | 190.607422 |
| 77 | 4/1/15 | 44.627991 | 193.340836 |
| 78 | 5/1/15 | 42.994816 | 195.826462 |
| 79 | 6/1/15 | 40.771599 | 190.95723 |
| 80 | 7/1/15 | 43.12648 | 196.136307 |
| 81 | 8/1/15 | 40.189812 | 185.614197 |
| 82 | 9/1/15 | 41.142715 | 178.559052 |
| 83 | 10/1/15 | 48.932507 | 195.695099 |
| 84 | 11/1/15 | 50.522064 | 195.507767 |
| 85 | 12/1/15 | 51.920101 | 190.992233 |
| 86 | 1/1/16 | 51.555122 | 182.563065 |
| 87 | 2/1/16 | 47.615261 | 182.412262 |
| 88 | 3/1/16 | 52.05724 | 193.683441 |
| 89 | 4/1/16 | 47.00515 | 195.44931 |
| 90 | 5/1/16 | 49.955341 | 198.774216 |
| 91 | 6/1/16 | 48.567814 | 198.433167 |
| 92 | 7/1/16 | 53.797611 | 206.740295 |
| 93 | 8/1/16 | 54.537945 | 206.987869 |
| 94 | 9/1/16 | 55.011574 | 205.959488 |
| 95 | 10/1/16 | 57.227314 | 203.411209 |
| 96 | 11/1/16 | 57.552036 | 210.904541 |
| 97 | 12/1/16 | 59.74847 | 213.919083 |
| 98 | 1/1/17 | 62.16188 | 219.030441 |
| 99 | 2/1/17 | 61.517666 | 227.63649 |
| 100 | 3/1/17 | 63.709213 | 226.933792 |
| 101 | 4/1/17 | 66.224304 | 230.183411 |
| 102 | 5/1/17 | 67.559242 | 233.431961 |
| 103 | 6/1/17 | 67.061157 | 233.780029 |
| 104 | 7/1/17 | 70.728943 | 239.748688 |
| 105 | 8/1/17 | 72.742813 | 240.448196 |
| 106 | 9/1/17 | 72.856537 | 244.081772 |
| 107 | 10/1/17 | 81.35598 | 251.073166 |
| 108 | 11/1/17 | 82.324265 | 258.747467 |
| 109 | 12/1/17 | 84.084389 | 260.553741 |
| 110 | 1/1/18 | 93.393242 | 276.645203 |
| 111 | 2/1/18 | 92.174339 | 266.586273 |
| 112 | 3/1/18 | 90.138329 | 258.24469 |
| 113 | 4/1/18 | 92.360428 | 260.618988 |
| 114 | 5/1/18 | 97.614464 | 266.954376 |
| 115 | 6/1/18 | 97.809433 | 267.289398 |
| 116 | 7/1/18 | 105.218788 | 278.436218 |
| 117 | 8/1/18 | 111.418053 | 287.323883 |
| 118 | 9/1/18 | 113.878044 | 287.729675 |
| 119 | 10/1/18 | 106.350555 | 269.058807 |
| 120 | 11/1/18 | 110.41301 | 274.049652 |
| 121 | 12/1/18 | 101.57 | 248.469025 |
Homework Answers


Formulas:
Beta measures the volatility (or systematic risk) of a stock relative to the volatility (unsystematic risk) of the whole market. Beta helps the investor to understand the direction in which the stock is likely to move compared to the market and how risky it is with respect to the market.
Add Answer to:
The purpose of this analysis is to find an intrinsic value for
Microsoft (MSFT) using the...
Cork price: 16 10 15 10 17 11 14 13 11 14 11 16 18 16...
Cork price: 16 10 15 10 17 11 14 13 11 14 11 16 18 16 10 17 14 14 16 7 10 12 19 15 16 14 9 12 21 13 10 16 12 16 13 17 17 13 14 18 11 12 15 16 13 18 16 17 12 12 14 9 11 14 19 13 11 17 11 13 15 14 18 18 18 12 10 11 13 14 11 14 18 13 13 19 17 14...
Problem 6. The set (Z19 − {0}, ·19) is a group with the indicated operation; see...
 Problem 6. The set (Z19 − {0}, ·19) is a group with the
indicated operation; see the attached table. a.) Show that H = {1,
7, 8, 11, 12, 18} is a subgroup. b.) List all the right cosets of
H. c.) Show that if Hy = Hx then xy−1 ∈ H. [Make sure to give a
reason for each step.] d.) Show that φ : H → Hx defined by φ(h) =
hx is one-to-one and onto. [Use the...
Problem 6. The set (Z19 − {0}, ·19) is a group with the
indicated operation; see the attached table. a.) Show that H = {1,
7, 8, 11, 12, 18} is a subgroup. b.) List all the right cosets of
H. c.) Show that if Hy = Hx then xy−1 ∈ H. [Make sure to give a
reason for each step.] d.) Show that φ : H → Hx defined by φ(h) =
hx is one-to-one and onto. [Use the...
For C++ Write a program that randomly generates 100 integers and sorts them using radix sort....
For C++ Write a program that randomly generates 100 integers and sorts them using radix sort. Note: Your output would not be the same as this sample output due to the randomness. Sample output: 0 0 1 1 1 1 1 1 1 1 2 2 2 2 2 2 2 2 2 3 3 3 3 4 4 4 4 4 4 4 4 5 5 5 6 6 6 6 6 6 7 7 7 7 7 7...
Are all disciplines in the University equally boring or there are some more boring than others? To...
Are all disciplines in the University equally boring or there are some more boring than others? To answer that question, a study performed at Columbia University counted the number of times per 5-minute interval when professors from three different departments said “uh” or “ah” during lectures to fill gaps between words. These counts were used as a proxy (approximation) for the measure of class boredom. The data from observing one hundred of 5-minute intervals from each of three departments’ professors were recorded in...
Suppose there are 100 identical firms in the market and the luggage industry is perfectly competitive....
 Suppose there are 100 identical firms in the market and the luggage industry is perfectly competitive. What does the market supply curve look like? 20 19 18 17 16 15 14 13 12 11 A 10 9 8 7 6 5 4 20 19 18 17 16 15 14 13 12 11 A 10 8 7 6 2 1 0 0 0 1 2 3 4 5 6 7 8 9 10 11 12 0 1 2 3 4 5...
Which of the following frequency tables shows a skewed data set? Select all that apply: Value...
Which of the following frequency tables shows a skewed data set? Select all that apply: Value Frequency 5 2 6 5 7 3 8 15 9 11 10 24 11 14 12 12 13 10 14 4 Value Frequency 13 2 14 5 15 14 16 13 17 23 18 26 19 15 20 2 Value Frequency 5 1 6 1 7 9 8 20 9 24 10 20 11 6 12 11 13 5 14 2 15 1 Value...
Review the 6 karyotypes in Figure 10 and determine the chromosomal disorder. Record the chromosomal disorder...
 Review the 6 karyotypes in Figure 10 and determine the
chromosomal disorder. Record the chromosomal disorder in
Data Table 3.
Describe the genotype of each chromosomal disorder and record
in Data Table 3.
Describe the phenotype of each chromosomal disorder and record
in Data Table 3.
Data Table 3: Karyotype to Genotype to Phenotype
#
Chromosomal Disorder
Genotype
Phenotype
1
2
3
4
5
6
1 2 3 4 5 6 7 8 1 2 3 4 5 6 7...
Review the 6 karyotypes in Figure 10 and determine the
chromosomal disorder. Record the chromosomal disorder in
Data Table 3.
Describe the genotype of each chromosomal disorder and record
in Data Table 3.
Describe the phenotype of each chromosomal disorder and record
in Data Table 3.
Data Table 3: Karyotype to Genotype to Phenotype
#
Chromosomal Disorder
Genotype
Phenotype
1
2
3
4
5
6
1 2 3 4 5 6 7 8 1 2 3 4 5 6 7...
Suppose there are 100 identical firms in the market and the luggage industry is perfectly competitive....
 Suppose there are 100 identical firms in the market and the luggage industry is perfectly competitive. What does the market supply curve look like? 20 19 18 17 16 15 14 13 12 11 A 10 20 19 18 17 16 15 14 13 12 11 A 10 8 7 5 2 1 0 1 0 0 1 2 3 4 5 6 7 8 9 10 11 12 4 5 6 7 8 9 10 11 12 0 1...
SQL – Microsoft Access -------------------------------------------------------------------------- Display the average trip distance for each pilot and use GROUP...
 SQL – Microsoft Access
--------------------------------------------------------------------------
Display the average trip distance for each pilot and use
GROUP BY
------------------------------------------------------------------------------
.82714 .6 9 7 4 1 3 6 5 2 54 200 49 3 5 0 3 2 3 24100。40 2 9 9 。 6 6 1 33 4 10 12 2 1 1 3 13 14 14 14 4 15 16 16 16 17 10 1 2 3 4 5 1 11
SQL – Microsoft Access
--------------------------------------------------------------------------
Display the average trip distance for each pilot and use
GROUP BY
------------------------------------------------------------------------------
.82714 .6 9 7 4 1 3 6 5 2 54 200 49 3 5 0 3 2 3 24100。40 2 9 9 。 6 6 1 33 4 10 12 2 1 1 3 13 14 14 14 4 15 16 16 16 17 10 1 2 3 4 5 1 11
 Problem 6. The set (Z19 − {0}, ·19) is a group with the
indicated operation; see the attached table. a.) Show that H = {1,
7, 8, 11, 12, 18} is a subgroup. b.) List all the right cosets of
H. c.) Show that if Hy = Hx then xy−1 ∈ H. [Make sure to give a
reason for each step.] d.) Show that φ : H → Hx defined by φ(h) =
hx is one-to-one and onto. [Use the...
Problem 6. The set (Z19 − {0}, ·19) is a group with the
indicated operation; see the attached table. a.) Show that H = {1,
7, 8, 11, 12, 18} is a subgroup. b.) List all the right cosets of
H. c.) Show that if Hy = Hx then xy−1 ∈ H. [Make sure to give a
reason for each step.] d.) Show that φ : H → Hx defined by φ(h) =
hx is one-to-one and onto. [Use the...
 Suppose there are 100 identical firms in the market and the luggage industry is perfectly competitive. What does the market supply curve look like? 20 19 18 17 16 15 14 13 12 11 A 10 9 8 7 6 5 4 20 19 18 17 16 15 14 13 12 11 A 10 8 7 6 2 1 0 0 0 1 2 3 4 5 6 7 8 9 10 11 12 0 1 2 3 4 5...
 Review the 6 karyotypes in Figure 10 and determine the
chromosomal disorder. Record the chromosomal disorder in
Data Table 3.
Describe the genotype of each chromosomal disorder and record
in Data Table 3.
Describe the phenotype of each chromosomal disorder and record
in Data Table 3.
Data Table 3: Karyotype to Genotype to Phenotype
#
Chromosomal Disorder
Genotype
Phenotype
1
2
3
4
5
6
1 2 3 4 5 6 7 8 1 2 3 4 5 6 7...
Review the 6 karyotypes in Figure 10 and determine the
chromosomal disorder. Record the chromosomal disorder in
Data Table 3.
Describe the genotype of each chromosomal disorder and record
in Data Table 3.
Describe the phenotype of each chromosomal disorder and record
in Data Table 3.
Data Table 3: Karyotype to Genotype to Phenotype
#
Chromosomal Disorder
Genotype
Phenotype
1
2
3
4
5
6
1 2 3 4 5 6 7 8 1 2 3 4 5 6 7...
 Suppose there are 100 identical firms in the market and the luggage industry is perfectly competitive. What does the market supply curve look like? 20 19 18 17 16 15 14 13 12 11 A 10 20 19 18 17 16 15 14 13 12 11 A 10 8 7 5 2 1 0 1 0 0 1 2 3 4 5 6 7 8 9 10 11 12 4 5 6 7 8 9 10 11 12 0 1...
 SQL – Microsoft Access
--------------------------------------------------------------------------
Display the average trip distance for each pilot and use
GROUP BY
------------------------------------------------------------------------------
.82714 .6 9 7 4 1 3 6 5 2 54 200 49 3 5 0 3 2 3 24100。40 2 9 9 。 6 6 1 33 4 10 12 2 1 1 3 13 14 14 14 4 15 16 16 16 17 10 1 2 3 4 5 1 11
SQL – Microsoft Access
--------------------------------------------------------------------------
Display the average trip distance for each pilot and use
GROUP BY
------------------------------------------------------------------------------
.82714 .6 9 7 4 1 3 6 5 2 54 200 49 3 5 0 3 2 3 24100。40 2 9 9 。 6 6 1 33 4 10 12 2 1 1 3 13 14 14 14 4 15 16 16 16 17 10 1 2 3 4 5 1 11
Most questions answered within 3 hours.
-
What is the oxidation number of each atom in sodium phosphate,
Na3PO4?
>>> SHOW YOUR WORK...
asked 2 minutes ago -
D company purchased goods with a list price of $60000, subject
to trade discounts of 20%...
asked 5 minutes ago -
Transposable elements make up more than 40% of the human genome
and are inserted more-or-less randomly...
asked 15 minutes ago -
Can I get some samples of the following:
1) Write four sentences in first person, singular....
asked 20 minutes ago -
Described how search engines work. Be sure to describe in detail
.
asked 21 minutes ago -
The position of a particle as a function of time is given by
x=(2.0m/s)t+(−3.0m/s3)t^3. Part A...
asked 26 minutes ago -
If you wanted to insert a gene into a plasmid, why
would it be helpful to...
asked 25 minutes ago -
Provide your solved Excel Model Spreadsheet + Answer Report +
Sensitivity Report.
There are 1,400/2,500/1,200/700 applicants...
asked 25 minutes ago -
There are 32 chocolates in a box, all identically shaped. There are
12 filled with nuts,...
asked 38 minutes ago -
There are n candies on the table. Alice and Bob independently
pick k random candies each....
asked 37 minutes ago -
Complete the following probability table. (Round Prior
Probability and Posterior Probability answers to 2 decimal places...
asked 34 minutes ago -
In carrying out the first standardization in an experiment, a
student used 0.5449g of potassium hydrogen...
asked 34 minutes ago