A metropolitan transportation authority has set a bus mechanical reliability goal of 3800 bus miles. Bus...
A metropolitan transportation authority has set a bus mechanical reliability goal of 3800 bus miles. Bus mechanical reliability is measured specifically as the number of bus miles between mechanical road calls. Suppose a sample of 100 buses resulted in a sample mean of 3825 bus miles and a sample standard deviation of 225 bus miles. Complete parts (a) and (b) below. a. Is there evidence that the population mean bus miles is more than 3800 bus miles? (Use a 0.05 level of significance.)
State the null and alternative hypotheses. H0: mu less than or equals 3800 H1: mu greater than 3800 (Type integers or decimals.) Find the test statistic for this hypothesis test. t Subscript STATequals 1.11 (Round to two decimal places as needed.)
The critical value(s) for the test statistic is(are) 1.66. ALSO HOW DID YOU GET THIS ANSWER OF 1.66 PLEASE SHARE DETAILS THANK YOU. (Round to two decimal places as needed. Use a comma to separate answers as needed.)
Is there sufficient evidence to reject the null hypothesis using alphaequals0.05?
A. Do not reject the null hypothesis. There is insufficient evidence at the 0.05 level of significance that the population mean bus miles is greater than 3 comma 800 bus miles. This is the correct answer.
B. Reject the null hypothesis. There is sufficient evidence at the 0.05 level of significance that the population mean bus miles is greater than 3 comma 800 bus miles.
C. Reject the null hypothesis. There is sufficient evidence at the 0.05 level of significance that the population mean bus miles is less than 3800 bus miles. Your answer is not correct.
D. Do not reject the null hypothesis. There is insufficient evidence at the 0.05 level of significance that the population mean bus miles is less than 3800 bus miles.
b. Determine the p-value and interpret its meaning.
The p-value is ___? PLEASE GIVE ME DETAILS ON HOW YOU GET THIS ANSWER AND THE TABLE YOU ARE USING BECAUSE IT'S NOT THE ZTABLE PLEASE POST PIC OF TABLE IF YOU CAN. THE ANSWER IS NOT .1335
Homework Answers
Null and Alternative Hypotheses
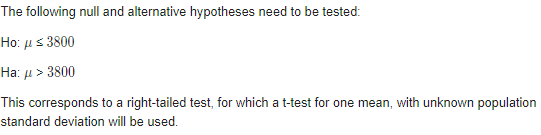
In word form, hypothesis can be written as:
H0: mu less than or equals 3800
H1: mu greater than 3800
Test Statistics


Critical Value
Based on the information provided,
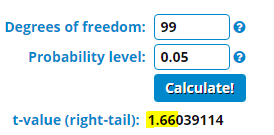
The significance level is α=0.05
Degrees of Freedom df = 100 - 1 = 99
The critical t value corresponding to α = 0.05 and df = 99 for a right tailed test is 1.66 (Obtained using t - value calculator. Screenshot attached below)
Conclusion
Since it is observed that t = 1.11 ≤ tc=1.66, we fail to reject null hypothesis.
There is insufficient evidence at the 0.05 level of significance that the population mean bus miles is greater than 3800 bus miles.
P-value
P-value corresponding to test statistic t = 1.11.and df = 99 for a right tailed test is 0.1346 (Obtained using p-value calculator. Screenshot below)
Please note calculator has been used because it is not possible to obtain accurate p-value from t-Distribution table.

Interpretation
In p-value is less than 0.05, we reject null hypothesis. In this case, p-value (0.1346) is greater than 0.05, so we fail to reject null hypothesis.
In technical terms, there is 13.46% chance of obtaining an effect at least as extreme as the sample data, assuming that the null hypothesis is true.
Add Answer to:
A metropolitan transportation authority has set a bus mechanical
reliability goal of 3800 bus miles. Bus...
A hospital was concerned about reducing its wait time. A targeted wait time goal of 25...
 A hospital was concerned about reducing its wait time. A targeted wait time goal of 25 minutes was set. After implementing an improvement framework and process, a sample of 332 patients showed the mean wait time was 23.14 minutes, with a standard deviation of 16.05 minutos. Complete parts (a) and (b) below. a. If you test the null hypothesis at the 0.05 level of significance, is there evidence that the population mean wait time is less than 25 minutes? State...
A hospital was concerned about reducing its wait time. A targeted wait time goal of 25...
 A hospital was concerned about reducing its wait time. A targeted wait time goal of 25 minutes was set. After implementing an improvement framework and process, a sample of 362 patients showed the mean wait time was 23.16 minutes, with a standard deviation of 16. 1 minutes. Complete parts (a) and (b) below. a. If you test the null hypothesis at the 0.05 level of significance, is there evidence that the population mean wait time is less than 25 minutes?...
A hospital was concerned about reducing its wait time. A targeted wait time goal of 25...
 A hospital was concerned about reducing its wait time. A targeted wait time goal of 25 minutes was set. After implementing an improvement framework and process, a sample of 351 patients showed the mean wait time was 23.15 minutes, with a standard deviation of 16.06 minutes. Complete parts (a) and (b) below. a. If you test the null hypothesis at the 0.10 level of significance, is there evidence that the population mean wait time is less than 25 minutes? State...
19 25 The sample of six measurements shown below was randomly selected from a normally distributed...
 19 25 The sample of six measurements shown below was randomly selected from a normally distributed population. Complete parts a through c. 1,2,3,3,4,1 a. Test the null hypothesis that the mean of the population is 3 against the alternative hypothesis. p < 3. Use a = 0.05 Ifq=0.05, find the rejection region for the test. Choose the correct answer below. % 1994 1994 OA. <-2015 or t> 2015 Oct-2571 O E. > 2571 OB < -2015 OD < -2571 ort...
A sample of five measurements, randomly selected from a normally distributed population, resulted in the following...
A sample of five measurements, randomly selected from a normally distributed population, resulted in the following summary statistics: x overbar equals4.4, sequals 1.3. Complete parts a through c. Test the null hypothesis that the mean of the population is 6 against the alternative hypothesis, mu less than6 . Use alpha equals0.05 . If alpha equals0.05 , find the rejection region for the test. Choose the correct answer below. A. tgreater than 2.776 B. tgreater than 2.132 C. tless than minus2.776or...
The sample of six measurements shown below was randomly selected from a normally distributed population. Complete...
 The sample of six measurements shown below was randomly selected from a normally distributed population. Complete parts a throughc 1,3, 1, 5, 1,2 a. Test the null hypothesis that the mean of the population is 3 against the alternative hypothesis, 3. Use a 0.10. If a = 0.10, find the rejection region for the test. Choose the correct answer below O A. t 2.015 or t> 2.015 O C. t-2015 O E. t1476 O B. t-1.476 O D. t 1.476...
A public bus company official claims that the mean waiting time for bus number 14 during...
A public bus company official claims that the mean waiting time for bus number 14 during peak hours is less than 10 minutes. Karen took bus number 14 during peak hours on 18 different occasions. Her mean waiting time was 9 minutes with a standard deviation of 2.9 minutes. At the 0.01 significance level, test the claim that the mean waiting time is less than 10 minutes. - Identify the null hypothesis and alternative hypothesis - Identify the test statistic...
A data set includes data from student evaluations of courses. The summary statistics are nequals 91,...
A data set includes data from student evaluations of courses. The summary statistics are nequals 91, x overbar equals4.17, sequals 0.69. Use a 0.10 significance level to test the claim that the population of student course evaluations has a mean equal to 4.25 . Assume that a simple random sample has been selected. Identify the null and alternative hypotheses, test statistic, P-value, and state the final conclusion that addresses the original claim. What are the null and alternative hypotheses? A....
00:55:16 A wedding website states that the average cost of a wedding is $29,205. One concerned...
 00:55:16 A wedding website states that the average cost of a wedding is $29,205. One concerned bride hopes that the average is less than reported. To see if her hope is correct, she surveys 36 recently married couples and finds that the average cost of weddings in the sample was $27,338. Assuming that the population standard deviation is $4532, is there sufficient evidence to support the bride's hope at the 0.02 level of significance? Step 3 of 3: Draw a...
A random sample of 100 observations from a population with standard deviation 76 yielded a sample...
 A random sample of 100 observations from a population with standard deviation 76 yielded a sample mean of 114. Complete parts a through c below. a. Test the null hypothesis that u = 100 against the alternative hypothesis that u > 100, using a = 0.05. Interpret the results of the test. What is the value of the test statistic? und to two decimal places as needed.) Find the p-value. p-value = (Round to three decimal places as needed.) State...
 A hospital was concerned about reducing its wait time. A targeted wait time goal of 25 minutes was set. After implementing an improvement framework and process, a sample of 332 patients showed the mean wait time was 23.14 minutes, with a standard deviation of 16.05 minutos. Complete parts (a) and (b) below. a. If you test the null hypothesis at the 0.05 level of significance, is there evidence that the population mean wait time is less than 25 minutes? State...
 A hospital was concerned about reducing its wait time. A targeted wait time goal of 25 minutes was set. After implementing an improvement framework and process, a sample of 362 patients showed the mean wait time was 23.16 minutes, with a standard deviation of 16. 1 minutes. Complete parts (a) and (b) below. a. If you test the null hypothesis at the 0.05 level of significance, is there evidence that the population mean wait time is less than 25 minutes?...
 A hospital was concerned about reducing its wait time. A targeted wait time goal of 25 minutes was set. After implementing an improvement framework and process, a sample of 351 patients showed the mean wait time was 23.15 minutes, with a standard deviation of 16.06 minutes. Complete parts (a) and (b) below. a. If you test the null hypothesis at the 0.10 level of significance, is there evidence that the population mean wait time is less than 25 minutes? State...
 19 25 The sample of six measurements shown below was randomly selected from a normally distributed population. Complete parts a through c. 1,2,3,3,4,1 a. Test the null hypothesis that the mean of the population is 3 against the alternative hypothesis. p < 3. Use a = 0.05 Ifq=0.05, find the rejection region for the test. Choose the correct answer below. % 1994 1994 OA. <-2015 or t> 2015 Oct-2571 O E. > 2571 OB < -2015 OD < -2571 ort...
 The sample of six measurements shown below was randomly selected from a normally distributed population. Complete parts a throughc 1,3, 1, 5, 1,2 a. Test the null hypothesis that the mean of the population is 3 against the alternative hypothesis, 3. Use a 0.10. If a = 0.10, find the rejection region for the test. Choose the correct answer below O A. t 2.015 or t> 2.015 O C. t-2015 O E. t1476 O B. t-1.476 O D. t 1.476...
 00:55:16 A wedding website states that the average cost of a wedding is $29,205. One concerned bride hopes that the average is less than reported. To see if her hope is correct, she surveys 36 recently married couples and finds that the average cost of weddings in the sample was $27,338. Assuming that the population standard deviation is $4532, is there sufficient evidence to support the bride's hope at the 0.02 level of significance? Step 3 of 3: Draw a...
 A random sample of 100 observations from a population with standard deviation 76 yielded a sample mean of 114. Complete parts a through c below. a. Test the null hypothesis that u = 100 against the alternative hypothesis that u > 100, using a = 0.05. Interpret the results of the test. What is the value of the test statistic? und to two decimal places as needed.) Find the p-value. p-value = (Round to three decimal places as needed.) State...
Most questions answered within 3 hours.
-
Calculate the pH of a 5.7 M solution of aniline (C6H5NH2; Kb =
3.8 x 10^-10)
asked 1 hour ago -
LSL R3, R3, R12
Memory
Address
Orig.
Data
Updated
Data
Register
Orig.
Data
Updated
Data
0x84F0...
asked 1 hour ago -
Air at 100 kPa and density of 1.2 kg/m3 flows upward through a
5-cm diameter inclined...
asked 1 hour ago -
Define the following concepts in your own words: (a) stiffness,
(b) strength, (c) strain,
(d) ductility,...
asked 2 hours ago -
In C++
In this homework, you will be tasked with creating functions to
manipulate strings that...
asked 3 hours ago -
An isolated colony represents a pure culture. one rare occasions
, however , a colony can...
asked 3 hours ago -
*****DO NOT ANSWER THIS QUESTION IF YOU DON'T
KNOW*******Rights and Duties of Auditors; Minimum 4000
words...
asked 4 hours ago -
The probability that Janie is wearing sunglasses is 1/4. The
probability that she is wearing sunglasses...
asked 4 hours ago -
Do you believe social media is more of a help or a hindrance in
controlling crises...
asked 4 hours ago -
Two long, parallel wires separated by 2.85 cm carry currents in
opposite directions. The current in...
asked 4 hours ago -
Question # 1. Develop a list of rehabilitation journals
that publish articles concerning career counseling for...
asked 4 hours ago -
Bryant Company has a factory machine with a book value of
$85,100 and a remaining useful...
asked 4 hours ago