For each of the following events, draw a market supply and demand graph schedule that illustrates...
- For each of the following events, draw a market supply and demand graph schedule that illustrates the likely effect on equilibrium price (Pe*) and quantity (Qe*). (30 points)
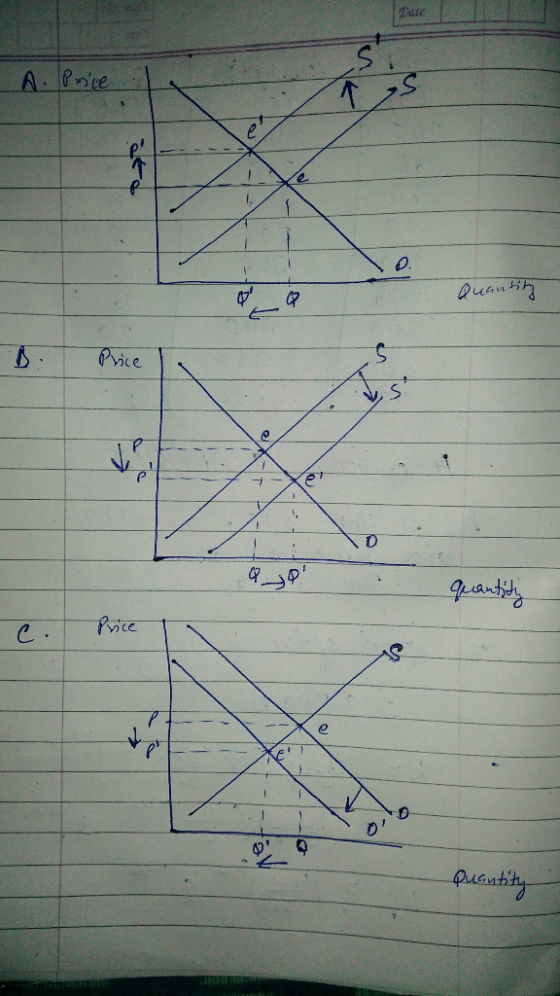
- The general rental rate of capital-an input cost-rises precipitously.
- The general wage rate paid to laborers falls.
C) Consumer income declines.
Homework Answers
A) increase in price of capital leads to increase in cost of production that leads to decrease in supply. At new equilibrium e' price increases and quantity decreases.
B) decrease in price of labor decreases cost of production that leads to increase in supply. At new equilibrium price decreases and quantity increases.
C) decrease in consumer income leads to decrease in demand. At new equilibrium e' both price and quantity decrease.
Add Answer to:
For each of the following events, draw a market
supply and demand graph schedule that illustrates...
Market demand (D) and supply (S) are the following GROUP A (1) Market demand (D) and...
 Market demand (D) and supply (S) are the following
GROUP A (1) Market demand (D) and supply (S) are D: P 40-Q, S: P - 3Q. Let Qe Quantity at equilibrium and Pe - Quantity at equilibrium. (a) Compute Qe and Pe and graph the D and S functions in the same graph with P on the vertical axis. (b) Show that at Q1-7, Net Market Benefits (NB) are less than NB at Qe. (c) Show that at Q2- 13,...
Market demand (D) and supply (S) are the following
GROUP A (1) Market demand (D) and supply (S) are D: P 40-Q, S: P - 3Q. Let Qe Quantity at equilibrium and Pe - Quantity at equilibrium. (a) Compute Qe and Pe and graph the D and S functions in the same graph with P on the vertical axis. (b) Show that at Q1-7, Net Market Benefits (NB) are less than NB at Qe. (c) Show that at Q2- 13,...
1. Draw the supply and demand for wheat on a graph, and indicate the equilibrium price...
1. Draw the supply and demand for wheat on a graph, and indicate the equilibrium price and quantity. Suppose rice and wheat are consumption substitutes, and corn and wheat are production substitutes. Describe and show what happens in the market for wheat when 2 events occur at the same time: 1) the price of corn increases, and 2), a drought (lack of rain) occurs in rice-growing regions, causing the supply of rice to fall.. Suppose the drought in rice has...
In this market the supply curve is given by Qs= 100Pe – 50Pt and the demand...
In this market the supply curve is given by Qs= 100Pe – 50Pt and the demand curve is given by Qd = 1000 – 150Pe + 100Pb, where Pe denotes daily price of education tuition, Pt denotes teacher wage per hour, and Pb denotes price of textbooks. a) Assume that Pt is fixed at $10 and Pb = $50. Calculate the equilibrium price and quantity. Illustrate this market using a supply and demand diagram. b) Suppose the teacher’s union successfully...
8. By using demand-supply analysis, show how the following events affect the equilibrium price (PE) and...
 8. By using demand-supply analysis, show how the following events affect the equilibrium price (PE) and quantity of GOOD X (QE). a) Price of related good (Y) decreases (The cross price elasticity of demand (Exy) is - 2) b) Simultaneously, popularity of good x decreases and there is an increase in the price of key input in the production of good x.
Draw a supply and demand graph for the market for air travel. Analyze the impact of an...
Draw a supply and demand graph for the market for air travel. Analyze the impact of an increase in the cost of jet fuel. Be sure to use just one graph, shifting either the demand curve or the supply curve the correct direction. Show the impact on equilibrium price and equilibrium quantity. Draw a supply and demand graph for new cars to show the impact of lower consumer incomes during the 2008-09 recession. Analyze the impact of a decrease in tariffs (taxes) on...
The data given below represent the demand schedule and the supply schedule of a certain commodity....
 The data given below represent the demand schedule and the supply schedule of a certain commodity. Based on the information given in the demand schedule and the supply schedule, answer g questions 1, 2, 3, and 4, properly. Price $7.20 7.00 6.80 6.60 6.40 6.20 6.00 5.80 Qd 10 15 20 25 30 35 Qs 35 30 25 20 15 10 45 1. 2. 3. 4. Sketch the demand and the supply schedules on graph paper. Label the Pe and...
For each of the following: draw a supply/demand graph for the currency market in question. Label...
For each of the following: draw a supply/demand graph for the currency market in question. Label axes, the supply and demand curves, and equilibrium exchange rate. Then show and explain with words what will happen to the market after the shock described. Include the effect on the foreign exchange rate. Explain. the market for Mexican Pesos - investors speculate that the Peso will soon appreciate the market for British pounds - Brexit scares investors, so investors leave the UK the...
37. If the demand for baseball cards rises and the supply curve does not shift, then...
 37. If the demand for baseball cards rises and the supply curve does not shift, then the price a. will rise and quantity will fall b. and quantity will rise c. will fall and quantity will rise d. and quantity will fall e. will rise, but quantity may rise or fall If the supply of coffee falls due to bad weather conditions in coffee-exporting countries, then the a. 38. price and quantity will rise b. price and quantity will fall...
The graph on the right shows the demand for and supply of labor in a market...
 The graph on the right shows the demand for and supply of labor in a market with an equilibrium wage rate of $9 per hour. Labor supply Show the impact on the graph if a minimum wage of $11 per hour is enacted. 1.) Using the point drawing tool, plot the point that illustrates the quantity of labor demanded when the minimum wage is set at $11 per hour. Label your point 'A.' 2.) Using the point drawing tool, plot...
For each of the following events, identify which of the determinants of demand or supply are...
 For each of the following events, identify which of the
determinants of demand or supply are affected. If demand is
unaffected by this event because it creates only a supply change,
select the “None” option under the “Demand Determinant” column.
Similarly, if supply is unaffected by this event because it creates
only a demand change, select the “None” option under the “Supply
Determinant” column.
for the table below here are the options:
Demand Determinant: Income, Price of substitude or
complement,...
For each of the following events, identify which of the
determinants of demand or supply are affected. If demand is
unaffected by this event because it creates only a supply change,
select the “None” option under the “Demand Determinant” column.
Similarly, if supply is unaffected by this event because it creates
only a demand change, select the “None” option under the “Supply
Determinant” column.
for the table below here are the options:
Demand Determinant: Income, Price of substitude or
complement,...
 Market demand (D) and supply (S) are the following
GROUP A (1) Market demand (D) and supply (S) are D: P 40-Q, S: P - 3Q. Let Qe Quantity at equilibrium and Pe - Quantity at equilibrium. (a) Compute Qe and Pe and graph the D and S functions in the same graph with P on the vertical axis. (b) Show that at Q1-7, Net Market Benefits (NB) are less than NB at Qe. (c) Show that at Q2- 13,...
Market demand (D) and supply (S) are the following
GROUP A (1) Market demand (D) and supply (S) are D: P 40-Q, S: P - 3Q. Let Qe Quantity at equilibrium and Pe - Quantity at equilibrium. (a) Compute Qe and Pe and graph the D and S functions in the same graph with P on the vertical axis. (b) Show that at Q1-7, Net Market Benefits (NB) are less than NB at Qe. (c) Show that at Q2- 13,...
 8. By using demand-supply analysis, show how the following events affect the equilibrium price (PE) and quantity of GOOD X (QE). a) Price of related good (Y) decreases (The cross price elasticity of demand (Exy) is - 2) b) Simultaneously, popularity of good x decreases and there is an increase in the price of key input in the production of good x.
 The data given below represent the demand schedule and the supply schedule of a certain commodity. Based on the information given in the demand schedule and the supply schedule, answer g questions 1, 2, 3, and 4, properly. Price $7.20 7.00 6.80 6.60 6.40 6.20 6.00 5.80 Qd 10 15 20 25 30 35 Qs 35 30 25 20 15 10 45 1. 2. 3. 4. Sketch the demand and the supply schedules on graph paper. Label the Pe and...
 37. If the demand for baseball cards rises and the supply curve does not shift, then the price a. will rise and quantity will fall b. and quantity will rise c. will fall and quantity will rise d. and quantity will fall e. will rise, but quantity may rise or fall If the supply of coffee falls due to bad weather conditions in coffee-exporting countries, then the a. 38. price and quantity will rise b. price and quantity will fall...
 The graph on the right shows the demand for and supply of labor in a market with an equilibrium wage rate of $9 per hour. Labor supply Show the impact on the graph if a minimum wage of $11 per hour is enacted. 1.) Using the point drawing tool, plot the point that illustrates the quantity of labor demanded when the minimum wage is set at $11 per hour. Label your point 'A.' 2.) Using the point drawing tool, plot...
 For each of the following events, identify which of the
determinants of demand or supply are affected. If demand is
unaffected by this event because it creates only a supply change,
select the “None” option under the “Demand Determinant” column.
Similarly, if supply is unaffected by this event because it creates
only a demand change, select the “None” option under the “Supply
Determinant” column.
for the table below here are the options:
Demand Determinant: Income, Price of substitude or
complement,...
For each of the following events, identify which of the
determinants of demand or supply are affected. If demand is
unaffected by this event because it creates only a supply change,
select the “None” option under the “Demand Determinant” column.
Similarly, if supply is unaffected by this event because it creates
only a demand change, select the “None” option under the “Supply
Determinant” column.
for the table below here are the options:
Demand Determinant: Income, Price of substitude or
complement,...
Most questions answered within 3 hours.
-
Please help me with FLOWCHART and UML diagram for class,
thank you!
#include <iostream>
#include <fstream>...
asked 13 minutes ago -
3. Describe the “logic circuit” of the Lac operon. Which
proteins are bound or not to...
asked 14 minutes ago -
Ayesha’s adjusted gross income is $60,000 in 2019. She donated a
piece of artwork with a...
asked 21 minutes ago -
For Dijkstra’s shortest path algorithm:
a. Give the Big-O time for Dijkstra’s shortest path algorithm
and...
asked 33 minutes ago -
Phosphorus violates the 'octet rule' in biological molecules,
forming more covalent bonds than expected based on...
asked 36 minutes ago -
A 1.3 eV electron has a 10-4 probability of tunneling
through a 2.4 eV potential barrier....
asked 55 minutes ago -
What is the one ingredient that is common to being successful
with all stakeholders?
profit
trust...
asked 54 minutes ago -
Write an assembly language 32 bit program that reads in lines of
text by a .txt...
asked 56 minutes ago -
what is the density ( in g/L) of hydrogen gas at 29 degrees C and a...
asked 1 hour ago -
5-6. You are considering three investment alternatives for some
spare cash: Old Reliable Corporation stock (A1),...
asked 57 minutes ago -
Problem 16-02
Receivables Investment
Medwig Corporation has a DSO of 45 days. The company averages
$7,250...
asked 1 hour ago -
Mr. Brown hired Lowe's Maintenance Services Limited to repair
and paint the exterior wall of his...
asked 1 hour ago