Q2: Twenty third graders were randomly separated into 4 groups and each group was taught a...
Q2: Twenty third graders were randomly separated into 4 groups and each group was taught a mathematical concept using a different teaching method. At the end of the teaching period, progress was measured by a unit test. The scores of shown below: (one child in group three was absent of the day the test was administered.)
(1) What type of design was used? (2) Construct an ANOVA table
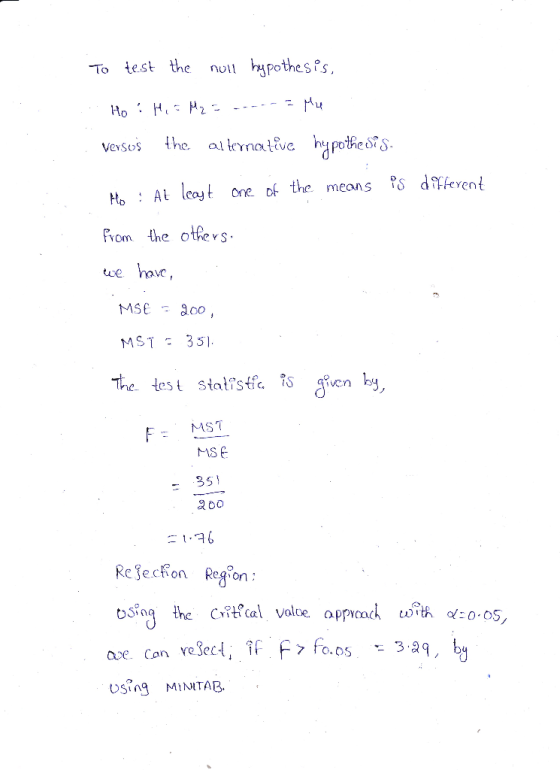
(3) Do the data present significant evidence to indicate a difference in the average scores for thefour teaching methods? Use α = .05.
|
group |
|||
|
1 |
2 |
3 |
4 |
|
112 |
111 |
140 |
101 |
|
92 |
129 |
121 |
116 |
|
124 |
102 |
130 |
105 |
|
89 |
136 |
106 |
126 |
|
97 |
99 |
--- |
119 |
Homework Answers
Q2: Twenty third graders were randomly separated in to 4 groups
and each group was taught a mathematical concept using a different
teaching method.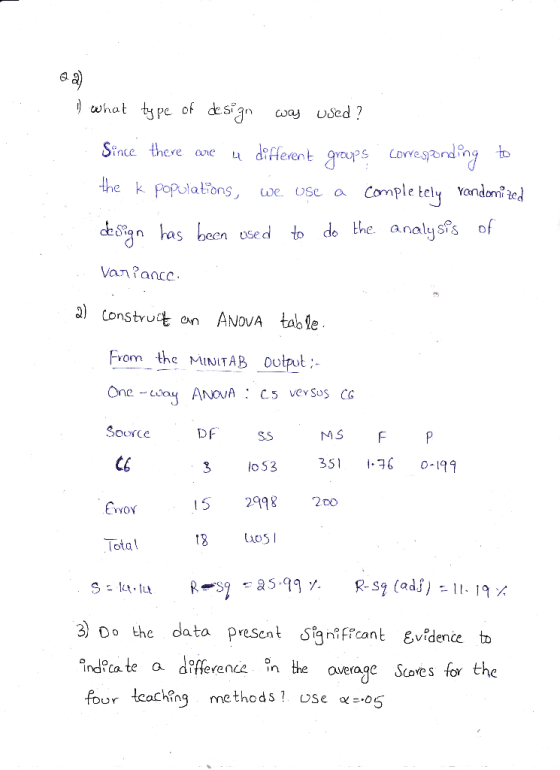

Add Answer to:
Q2: Twenty third graders were randomly separated into 4 groups
and each group was taught a...
Twenty third graders were randomly separated into four equal groups, and each group was taught a...
 Twenty third graders were randomly separated into four equal groups, and each group was taught a mathematical concept using a different teaching method. At the end of the teaching period, progress was measured by a unit test. From the data, answer the following questions. 1. What is the mean square error? a. 102.8 b. 194.9 c. 311.5 d. 201.9 2. What is the value of the F statistic in the analysis? a. 1.42 b. -2.87 c. 1.60 d. 9.87 3....
How do I plot a series graph with this data provided? Month 1987 1988 1989 1990...
How do I plot a series graph with this data provided? Month 1987 1988 1989 1990 1991 1992 1993 1994 1995 1996 Jan 95 104 101 88 132 125 111 127 119 147 Feb 94 100 96 110 109 118 123 129 147 146 Mar 98 99 82 129 101 121 121 132 164 133 Apr 96 88 84 113 111 140 139 108 135 148 May 95 89 85 114 140 141 119 115 124 141 Jun 115 108...
1. The data are from the U.S. Department of Health and Human Services, National Center of...
 1. The data are from the U.S. Department of Health and Human Services, National Center of Health Statistics, Third National Health and Nutrition Examination Survey. The systolic blood pressure (mmHg) for 80 patients was measured. The following data is separated by gender Females: 89 92 93 93 94 95 97 98 99 100 101 102 104 104 104 105 106 106 107 107 107 108 108 110 112 113 113 114 114 116 116 118 119 123 124 125 127...
The data studies the effect of dietary calcium on blood pressure. In the experiment, one group...
The data studies the effect of dietary calcium on blood pressure. In the experiment, one group of black male adults received calcium supplements for 12 weeks. A control group of black male adults was given placebos for 12 weeks. Earlier tests indicated that calcium could be more effective in the black population. The data are seated systolic blood pressure at the beginning and end of the 12 weeks measured in mm Hg. The data include the decrease after 12 weeks...
GUIDED EXERCISE 4 STEM-AND-LEAF DISPLAY What does it take to win at sports? If you're talking...
 GUIDED EXERCISE 4 STEM-AND-LEAF DISPLAY What does it take to win at sports? If you're talking about basketball, one sportswriter gave the answer. He listed th e winning scores of the conference championship games over the last 35 year. The scores for those games folow below. 132 118 124 109 104101 125 83 116 106 119 110 105 128 112 126 105 102 To make a stem-and-leaf display, we'll use the first two digits as the stems 131 98 125...
Maintaining a healthy weight is important for women’s health. Some physicians recommend being back to your...
Maintaining a healthy weight is important for women’s health. Some physicians recommend being back to your pre-pregnancy weight six months after giving birth. Public health officials are interested in whether this is a realistic goal. Do the women in North Carolina weigh more than their pre-pregnancy weight six months postpartum? In other words, is the six months post-pregnancy weight greater than their pre-pregnancy weight? Use a paired samples t-test to compare pst6wght (variable 1) and prewght (variable 2). This uses...
Weight IQ 88 99 112 103 107 97 112 99 80 100 86 90 103 118...
Weight IQ 88 99 112 103 107 97 112 99 80 100 86 90 103 118 121 79 116 80 82 88 65 82 107 103 100 116 91 112 110 92 113 115 105 100 108 94 90 118 73 106 102 126 99 95 80 119 114 116 90 79 95 92 106 78 86 111 106 80 Use the Weight_vs_IQ data. SETUP: Common sense dictates that a person’s IQ and Weight should not be related. However, one...
In what follows use any of the following tests/procedures: Regression, confidence intervals, one-sided t-test, or two-sided...
In what follows use any of the following tests/procedures: Regression, confidence intervals, one-sided t-test, or two-sided t-test. All the procedures should be done with 5% P-value or 95% confidence interval. Open Weight_vs_IQ data. SETUP: Common sense dictates that a person’s IQ and Weight should not be related. However, one never knows until one examines the data. Given the data (IQ and weight for 29 students) your job is to check if the common sense assumption is reasonable or maybe it...
Compute the correlation coefficient, r, for all five variables (columns). Interpret your findings whether you have determined any relationship between variables. X1 X2 X3 X4 X5 The data (X1, X...
Compute the correlation coefficient, r, for all five variables (columns). Interpret your findings whether you have determined any relationship between variables. X1 X2 X3 X4 X5 The data (X1, X2, X3, X4, X5) are by city. 8 78 284 9.1 109 X1 = death rate per 1000 residents 9.3 68 433 8.7 144 X2 = doctor availability per 100,000 residents 7.5 70 739 7.2 113 X3 = hospital availability per 100,000 residents 8.9 96 1792 8.9 97 X4 = annual...
How to solve this USING SAS EG? THANKS Automobile collisions: The number of collision claims (COL...
How to solve this USING SAS EG? THANKS Automobile collisions: The number of collision claims (COLLISION) reported for 1984-1986 cars are listed for 9 car categories: small two-door, midsized two-door, large two-door, small four-door, midsized four-door, large four-door, small station wagons and vans, midsized station wagons and vans, large station wagons and vans.. a. In excel convert the data to the format which is appropriate for SAS EG (the data should have 2 columns with names CARCLAS and CRASH). b....
 Twenty third graders were randomly separated into four equal groups, and each group was taught a mathematical concept using a different teaching method. At the end of the teaching period, progress was measured by a unit test. From the data, answer the following questions. 1. What is the mean square error? a. 102.8 b. 194.9 c. 311.5 d. 201.9 2. What is the value of the F statistic in the analysis? a. 1.42 b. -2.87 c. 1.60 d. 9.87 3....
 1. The data are from the U.S. Department of Health and Human Services, National Center of Health Statistics, Third National Health and Nutrition Examination Survey. The systolic blood pressure (mmHg) for 80 patients was measured. The following data is separated by gender Females: 89 92 93 93 94 95 97 98 99 100 101 102 104 104 104 105 106 106 107 107 107 108 108 110 112 113 113 114 114 116 116 118 119 123 124 125 127...
 GUIDED EXERCISE 4 STEM-AND-LEAF DISPLAY What does it take to win at sports? If you're talking about basketball, one sportswriter gave the answer. He listed th e winning scores of the conference championship games over the last 35 year. The scores for those games folow below. 132 118 124 109 104101 125 83 116 106 119 110 105 128 112 126 105 102 To make a stem-and-leaf display, we'll use the first two digits as the stems 131 98 125...
Most questions answered within 3 hours.
-
Write a program to create a game map. A game map is a 2D array
of...
asked 6 minutes ago -
2. When a student ran an asymmetric dihydroxylation reaction
using cis-stilbene and the ligand (DHQ)2PHAL, the...
asked 5 minutes ago -
The daily closing price of FPT stock over last year would
be:
A.Time series data
B.Cross...
asked 20 minutes ago -
A hair is placed at one edge between two flat glass plates 10.7
cm long. When...
asked 20 minutes ago -
1. The government has now decided to implement a price ceiling
of $100 in this market....
asked 23 minutes ago -
An object with charge q = −4.00×10⁻⁹ C is placed in a region of
uniform electric...
asked 44 minutes ago -
A retired couple buys a new recreational vehicle (RV) for $ 50
comma 000.00 . They...
asked 43 minutes ago -
Question 1 (1 point)
What's measured in mass spectrometry?
Frequency
Atomic number
Mass
Molecular weight
Question...
asked 57 minutes ago -
Jupiter Satellite
Corporation earned $19.8 million for the fiscal year ending
yesterday. The firm also paid...
asked 1 hour ago -
Your pizza restaurant uses the finest food ingredients to make
authentic brick-oven pizzas, and your mozarella...
asked 54 minutes ago -
How does social media affect and reflect on today’s culture?
asked 58 minutes ago -
Value-Stream Costing Objective
During the week of June 12, Harrison Manufacturing produced and
shipped 18,200 units...
asked 1 hour ago