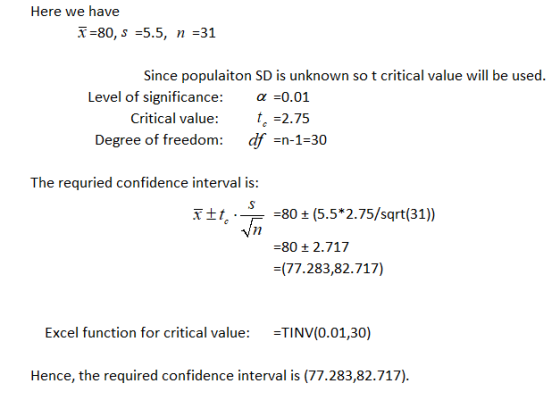
A sample of 31 students was randomly selected from a large group taking a certain calculus...
A sample of 31 students was randomly selected from a large group taking a certain calculus test. the mean score for the students in the sample was 80 that s=5.5,
a)construct a 99% confidence interval foe the mean score ,μ, of all students taking the test (round final answer to first decimal place)
b) construct a 99% confidence interval for the mean score ,μ, of all students taking the test when the sample size is increased to 101 students (round final answer to first decimal place)
c) How does increasing the sample size affect the margin of error?
d)interpret your answer from part (a)
Homework Answers
a)
b)

(c)
As the sample size increases, confidence interval becomes narrower.
Add Answer to:
A sample of 31 students was randomly selected from a large group
taking a certain calculus...
arameter Estimation .C 11. Thirty-five randomly selected students took the calculus final. If the sample mean...
 arameter Estimation .C 11. Thirty-five randomly selected students took the calculus final. If the sample mean was 82 and standard deviation was 4.6, construct a 99% confidence interval for the mean score of all students. 35 Provide estimates and circle one of the multiple choice answers. (6 points) 34.
14. Randomly selected students participated in an experiment to test their ability to determine when one...
14. Randomly selected students participated in an experiment to test their ability to determine when one minute (or sixty seconds) has passed. Forty students yielded a sample mean of 61.8 seconds. Assuming that σ=9.2 seconds, construct and interpret a 95% confidence interval estimate of the population mean of all students. What is the 95% confidence interval for the population mean μ? ____<μ<____ (Type integers or decimals rounded to one decimal place as needed.) 15. Salaries of 43 college graduates who...
6 Parameter Estimation 11. Thirty-five randomly selected students took the calculus final. If the sample mean...
 6 Parameter Estimation 11. Thirty-five randomly selected students took the calculus final. If the sample mean was 82 and standard deviation was 4.6construct score of all students Provide estimates and circle one of the multiple choice answers. (6 points) a 99% confidence interval for the mean ,
Use the given degree of confidence and sample data to construct a confidence interval for the...
Use the given degree of confidence and sample data to construct a confidence interval for the population mean mu. Assume that the population has a normal distribution. Thirty randomly selected students took the calculus final. If the sample mean was 75 and the standard deviation was 5.8, construct a 99% confidence interval for the mean score of all students. Round to two decimal places. A. 73.20<μ<76.80 B. 72.09<μ<77.91 C. 72.08<μ<77.92 D. 72.39<μ<77.61
A sample of 250 students who were taking online courses were asked to describe their overall...
A sample of 250 students who were taking online courses were asked to describe their overall impression of online learning on a scale of 1-7 with 7 representing the most favorable impression. The average score was 4.98 and the standard deviation was 0.87. Construct a 90% confidence interval for the mean score. Round your final answers to 3 decimal places. The 90% confidence interval for the mean score is: ( , )
Use the given degree of confidence and sample data to construct a confidence interval for the...
 Use the given degree of confidence and sample data to construct a confidence interval for the population mean H. Assume that the population has a normal distribution. Thirty randomly selected students took the calculus final. If the sample mean was 82 and the standard deviation was 12.6, construct a 99% confidence interval for the mean score of all students. Round to two decimal places. O A. 75.68 < < 88.32 OB. 75.66<u < 88.34 OC. 78.09 < < 85.91 OD....
Scores on a 100-point final exam administered to all applied calculus classes at a large university are normally di...
 Scores on a 100-point final exam administered to all applied calculus classes at a large university are normally distributed with a mean of 69.3 and a standard deviation of 29.45. (a) What percentage of students taking the test had scores between 60 and 80? (Round your answer to one decimal place.) % (b) At what score was the rate of change of the probability density function for the scores a maximum?
Scores on a 100-point final exam administered to all...
Scores on a 100-point final exam administered to all applied calculus classes at a large university are normally distributed with a mean of 69.3 and a standard deviation of 29.45. (a) What percentage of students taking the test had scores between 60 and 80? (Round your answer to one decimal place.) % (b) At what score was the rate of change of the probability density function for the scores a maximum?
Scores on a 100-point final exam administered to all...
4. Here is a sample of ACT scores for students taking college freshman cal- culus. Assume...
4. Here is a sample of ACT scores for students taking college freshman cal- culus. Assume that the population of students taking college freshman calculus follows a normal distribution: 24.00 20.00 23.50 25.00 21.50 28.00 (a) Calculate a 99% confidence interval for the population mean. (b) Calculate a 99% confidence interval for the standard deviation of the population distribution.
A group of 67 randomly selected students have a mean score of 31.3 with a standard...
 A group of 67 randomly selected students have a mean score of 31.3 with a standard deviation of 5.3 on a placement test. What is the 90% confidence interval for the mean score of all students taking the test? 30.2 < 32.4 30.2 < р < 32.4 33.02 H1 < 35.04 33.02 < р < 35.04
A certain test preparation course is designed to help students improve their scores on the GMAT...
A certain test preparation course is designed to help students improve their scores on the GMAT exam. A mock exam is given at the beginning and end of the course to determine the effectiveness of the course. The following measurements are the net change in 55 students' scores on the exam after completing the course: 14,29,24,10,17 Using these data, construct a 90%confidence interval for the average net change in a student's score after completing the course. Assume the population is...
 arameter Estimation .C 11. Thirty-five randomly selected students took the calculus final. If the sample mean was 82 and standard deviation was 4.6, construct a 99% confidence interval for the mean score of all students. 35 Provide estimates and circle one of the multiple choice answers. (6 points) 34.
 6 Parameter Estimation 11. Thirty-five randomly selected students took the calculus final. If the sample mean was 82 and standard deviation was 4.6construct score of all students Provide estimates and circle one of the multiple choice answers. (6 points) a 99% confidence interval for the mean ,
 Use the given degree of confidence and sample data to construct a confidence interval for the population mean H. Assume that the population has a normal distribution. Thirty randomly selected students took the calculus final. If the sample mean was 82 and the standard deviation was 12.6, construct a 99% confidence interval for the mean score of all students. Round to two decimal places. O A. 75.68 < < 88.32 OB. 75.66<u < 88.34 OC. 78.09 < < 85.91 OD....
 Scores on a 100-point final exam administered to all applied calculus classes at a large university are normally distributed with a mean of 69.3 and a standard deviation of 29.45. (a) What percentage of students taking the test had scores between 60 and 80? (Round your answer to one decimal place.) % (b) At what score was the rate of change of the probability density function for the scores a maximum?
Scores on a 100-point final exam administered to all...
Scores on a 100-point final exam administered to all applied calculus classes at a large university are normally distributed with a mean of 69.3 and a standard deviation of 29.45. (a) What percentage of students taking the test had scores between 60 and 80? (Round your answer to one decimal place.) % (b) At what score was the rate of change of the probability density function for the scores a maximum?
Scores on a 100-point final exam administered to all...
 A group of 67 randomly selected students have a mean score of 31.3 with a standard deviation of 5.3 on a placement test. What is the 90% confidence interval for the mean score of all students taking the test? 30.2 < 32.4 30.2 < р < 32.4 33.02 H1 < 35.04 33.02 < р < 35.04
Most questions answered within 3 hours.
-
An empty test tube weighs 15.923 grams. Then,
MgCl2•6H2O is added into the test tube. After...
asked 42 minutes ago -
Please answer true or false. Words
cannot be changed or added in to make it true...
asked 40 minutes ago -
(a) A piston at 6.1 atm contains a gas that occupies a volume of
3.5 L....
asked 41 minutes ago -
Assume memory access is 10 units of time and disk access is
10000 units of time....
asked 1 hour ago -
1. Are all good samples random?
2. Magazines often report surveys giving statistics such as “63%...
asked 1 hour ago -
Under all the various types of market structures, firms
must eventually earn some economic profits for...
asked 1 hour ago -
Consider the following fitness regime for a single locus trait
with two co-dominant alleles: w11 =...
asked 1 hour ago -
A large cable company reports the following.
80% of its customers subscribe to its cable TV...
asked 1 hour ago -
Please answer the question in brief.
Discuss the role of ERP in organizations. Are ERP tools...
asked 1 hour ago -
Discuss the pros and cons of collaborative software such
as SameTime. Does it increase productivity? What...
asked 1 hour ago -
Buying your in-laws a gift because it’s expected is
due to the ____________ motive of gift-giving....
asked 1 hour ago -
Calculate the expected value, the variance, and the standard
deviation of the given random variable X....
asked 2 hours ago