6. The manufacturer of high-quality flatbed scanners is trying to decide what price to set for...
6. The manufacturer of high-quality flatbed scanners is trying to decide what price to set for its product. The costs of production and the demand for the product are assumed to be as follows:
TC = 500,000 + 0.85Q + (0.015Q)(0.015Q)
Q = 14,166 - 16.6P
a. Determine the short-run profit-maximizing price.
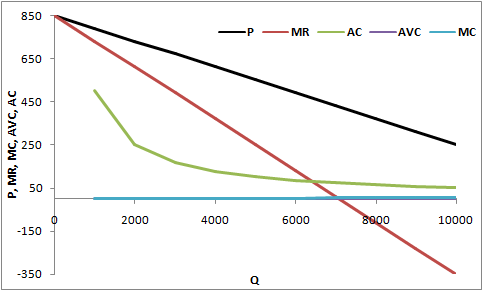
b. Plot this information on a graph showing AC, AVC, MC, P, and MR.
Homework Answers
TC = 500,000 + 0.85Q + (0.015Q)2 = 500,000 + 0.85Q + 0.000225Q2
MC = dTC/dQ = 0.85 + 0.00045Q
Q = 14,166 - 16.6P, so
16.6P = 14,166 - Q
P = (14,166 - Q) / 16.6
(a)
Profit is maximized when MR = MC
Total revenue (TR) = P x Q = (14,166Q - Q2) / 16.6
MR = dTR/dQ = (14,166 - 2Q) / 16.6
(14,166 - 2Q) / 16.6 = 0.85 + 0.00045Q
14,166 - 2Q = 14.11 + 0.00747Q
2.00747Q = 14,151.89
Q = 7,050
P = (14,166 - 7,050) / 16.6 = 7,116 / 16.6 = 428.67
(b)
AC = TC/Q = (500,000/Q) + 0.85 + 0.000225Q
TVC = 0.85Q + 0.000225Q2
AVC = TVC/Q = 0.85 + 0.000225Q
Data table used:
| Q | P | MR | AC | AVC | MC |
| 0 | 853.37 | 853.37 | |||
| 1000 | 793.13 | 732.89 | 501.08 | 1.075 | 1.3 |
| 2000 | 732.89 | 612.41 | 251.30 | 1.3 | 1.75 |
| 3000 | 672.65 | 491.93 | 168.19 | 1.525 | 2.2 |
| 4000 | 612.41 | 371.45 | 126.75 | 1.75 | 2.65 |
| 5000 | 552.17 | 250.96 | 101.98 | 1.975 | 3.1 |
| 6000 | 491.93 | 130.48 | 85.53 | 2.2 | 3.55 |
| 7000 | 431.69 | 10.00 | 73.85 | 2.425 | 4 |
| 8000 | 371.45 | -110.48 | 65.15 | 2.65 | 4.45 |
| 9000 | 311.20 | -230.96 | 58.43 | 2.875 | 4.9 |
| 10000 | 250.96 | -351.45 | 53.10 | 3.1 | 5.35 |
Graph:
Add Answer to:
6. The manufacturer of high-quality flatbed scanners is trying
to decide what price to set for...
The manufacturer of high-quality flatbed scanners is trying to decide what price to set for its...
The manufacturer of high-quality flatbed scanners is trying to decide what price to set for its product. The costs of production and the demand for the product are assumed to be as follows: TC = 500,000 + 0.85Q + 0.015Q 2 Q = 14,166 - 16.6P a. Determine the short-run profit-maximizing price. b. Explain why the demand curve facing a monopolist is less elastic than one facing a firm that operates in a monopolistically competitive market (all other factors held...
7. The manufacturer of high-quality flatbed scanners is trying to decide whether or not they have...
 7. The manufacturer of high-quality flatbed scanners is trying to decide whether or not they have achieved their performance goal. The cost function for this company is estimated to be as follows: TC 4050Q5Q2 a) What are the manufacturer's average total cost, average variable cost, and marginal cost? (2marks) b) Find the quantity that minimizes ATC. (2 marks) c) Show that ATC MC when ATC is minimized (2 marks)
The market price is p=50 3. Consider a competitive firm with total costs given by TC(q)...
 The market price is p=50
3. Consider a competitive firm with total costs given by TC(q) = 100 + 10q+q? (e) Graph the ATC, AVC, MC, and MR curves in a single graph, and indicate the profit maximizing level of output. If there are profits, shade the region corre- sponding to profit and label it. (f) If fixed costs increase from 100 to 500, what happens to the profit maximizing level of output, TR, TC, and a? (g) If fixed...
The market price is p=50
3. Consider a competitive firm with total costs given by TC(q) = 100 + 10q+q? (e) Graph the ATC, AVC, MC, and MR curves in a single graph, and indicate the profit maximizing level of output. If there are profits, shade the region corre- sponding to profit and label it. (f) If fixed costs increase from 100 to 500, what happens to the profit maximizing level of output, TR, TC, and a? (g) If fixed...
8. Consider the following Demand (Price and Marginal Revenue) and Cost (Total and Marginal) relationships expressed...
8. Consider the following Demand (Price and Marginal Revenue) and Cost (Total and Marginal) relationships expressed as functions of Q: Price = P(Q) = 310 – 2Q TC = TC(Q) = 3500 + 70Q + Q2 MR = MR(Q) = 310 – 4Q MC = MC(Q) = 70 + 2Q a. What is the profit-maximizing level of output? What is the price at that level? b. Should the firm continue operating in the short run? In the long run? c....
Consider a competitive rm with total costs given by TC(q) = 100 + 10q + q^2,...
Consider a competitive rm with total costs given by TC(q) = 100 + 10q + q^2, The firm faces a market price p = 50. (a) Write expressions for total revenue TR and marginal revenue MR as functions of output q. (b) Write expressions for average total cost ATC, average variable cost AVC, and marginal cost MC as functions of output q. (c) For what value of output is ATC minimized? (d) Find the profit maximizing level of output q...
show all steps and formulas VC A product in a perfectly competitive market is $6. Assume...
 show all steps and formulas
VC A product in a perfectly competitive market is $6. Assume the firm is subject to the following outputs and cost MR= TC MC= ATC Profit/Loss ATR/AQ ATR/AQ 200 250 12.5 -130 399 500 600 700 850 158 1000 191 1200 16 219 1700 7.76 II. Complete the table Plot the demand, MR, ATC and MC curves on a graph. Identify the profit maximizing output and price. Is this firm maximizing profits? Explain Can this...
show all steps and formulas
VC A product in a perfectly competitive market is $6. Assume the firm is subject to the following outputs and cost MR= TC MC= ATC Profit/Loss ATR/AQ ATR/AQ 200 250 12.5 -130 399 500 600 700 850 158 1000 191 1200 16 219 1700 7.76 II. Complete the table Plot the demand, MR, ATC and MC curves on a graph. Identify the profit maximizing output and price. Is this firm maximizing profits? Explain Can this...
1. A monopoly is facing an inverse demand curve that is p=200-5q. There is no fixed cost and the marginal cost of produc...
 1. A monopoly is facing an inverse demand curve that is
p=200-5q. There is no fixed cost and the marginal cost of
production is given and it is equal to 50.
Find the total revenue function.
Find marginal revenue (MR).
Draw a graph showing inverse demand, MR, and marginal cost
(MC).
Find the quantity (q) that maximizes the profit.
Find price (p) that maximizes the profit.
Find total cost (TC), total revenue (TR), and profit made by
this firm.
Find...
1. A monopoly is facing an inverse demand curve that is
p=200-5q. There is no fixed cost and the marginal cost of
production is given and it is equal to 50.
Find the total revenue function.
Find marginal revenue (MR).
Draw a graph showing inverse demand, MR, and marginal cost
(MC).
Find the quantity (q) that maximizes the profit.
Find price (p) that maximizes the profit.
Find total cost (TC), total revenue (TR), and profit made by
this firm.
Find...
Question 26 5 pts Price ATC MC AVC DD . m 0 Quantity Refer to the...
 Question 26 5 pts Price ATC MC AVC DD . m 0 Quantity Refer to the diagram above. At the point markede, o price is determining production at a level where P = AVC o TR is exactly equal to TC, so profits equal zero. o price is above average cost of production. o the leftover rectangle is the profit earned. Question 28 4 pts The following figure shows the average cost curve, demand curve, and marginal revenue curve for...
2. (54 points) Short-run costs. Suppose w 1, r 10 and K 20. C )q3 +200 a) (5 points) We have TC = WG) q3 + rK = On one graph (with q on the horizontal axis), graph the Total Cost, Variable Cost, and...
 2. (54 points) Short-run costs. Suppose w 1, r 10 and K 20. C )q3 +200 a) (5 points) We have TC = WG) q3 + rK = On one graph (with q on the horizontal axis), graph the Total Cost, Variable Cost, and Fixed Cost functions. Pay attention to the shape of the curves, where they intercept the axes and each other (if they do), and the position of the curves relative to each other b) (9 points) Using...
QUESTION 39 Price and cost MC ATC AVC N O P MR Demand RSTU Quantity (per...
 QUESTION 39 Price and cost MC ATC AVC N O P MR Demand RSTU Quantity (per period) The figure above shows different curves for a short-run monopolist. What is the profit-maximizing quantity level? OQ OR Os От Ου
 7. The manufacturer of high-quality flatbed scanners is trying to decide whether or not they have achieved their performance goal. The cost function for this company is estimated to be as follows: TC 4050Q5Q2 a) What are the manufacturer's average total cost, average variable cost, and marginal cost? (2marks) b) Find the quantity that minimizes ATC. (2 marks) c) Show that ATC MC when ATC is minimized (2 marks)
 The market price is p=50
3. Consider a competitive firm with total costs given by TC(q) = 100 + 10q+q? (e) Graph the ATC, AVC, MC, and MR curves in a single graph, and indicate the profit maximizing level of output. If there are profits, shade the region corre- sponding to profit and label it. (f) If fixed costs increase from 100 to 500, what happens to the profit maximizing level of output, TR, TC, and a? (g) If fixed...
The market price is p=50
3. Consider a competitive firm with total costs given by TC(q) = 100 + 10q+q? (e) Graph the ATC, AVC, MC, and MR curves in a single graph, and indicate the profit maximizing level of output. If there are profits, shade the region corre- sponding to profit and label it. (f) If fixed costs increase from 100 to 500, what happens to the profit maximizing level of output, TR, TC, and a? (g) If fixed...
 show all steps and formulas
VC A product in a perfectly competitive market is $6. Assume the firm is subject to the following outputs and cost MR= TC MC= ATC Profit/Loss ATR/AQ ATR/AQ 200 250 12.5 -130 399 500 600 700 850 158 1000 191 1200 16 219 1700 7.76 II. Complete the table Plot the demand, MR, ATC and MC curves on a graph. Identify the profit maximizing output and price. Is this firm maximizing profits? Explain Can this...
show all steps and formulas
VC A product in a perfectly competitive market is $6. Assume the firm is subject to the following outputs and cost MR= TC MC= ATC Profit/Loss ATR/AQ ATR/AQ 200 250 12.5 -130 399 500 600 700 850 158 1000 191 1200 16 219 1700 7.76 II. Complete the table Plot the demand, MR, ATC and MC curves on a graph. Identify the profit maximizing output and price. Is this firm maximizing profits? Explain Can this...
 1. A monopoly is facing an inverse demand curve that is
p=200-5q. There is no fixed cost and the marginal cost of
production is given and it is equal to 50.
Find the total revenue function.
Find marginal revenue (MR).
Draw a graph showing inverse demand, MR, and marginal cost
(MC).
Find the quantity (q) that maximizes the profit.
Find price (p) that maximizes the profit.
Find total cost (TC), total revenue (TR), and profit made by
this firm.
Find...
1. A monopoly is facing an inverse demand curve that is
p=200-5q. There is no fixed cost and the marginal cost of
production is given and it is equal to 50.
Find the total revenue function.
Find marginal revenue (MR).
Draw a graph showing inverse demand, MR, and marginal cost
(MC).
Find the quantity (q) that maximizes the profit.
Find price (p) that maximizes the profit.
Find total cost (TC), total revenue (TR), and profit made by
this firm.
Find...
 Question 26 5 pts Price ATC MC AVC DD . m 0 Quantity Refer to the diagram above. At the point markede, o price is determining production at a level where P = AVC o TR is exactly equal to TC, so profits equal zero. o price is above average cost of production. o the leftover rectangle is the profit earned. Question 28 4 pts The following figure shows the average cost curve, demand curve, and marginal revenue curve for...
 2. (54 points) Short-run costs. Suppose w 1, r 10 and K 20. C )q3 +200 a) (5 points) We have TC = WG) q3 + rK = On one graph (with q on the horizontal axis), graph the Total Cost, Variable Cost, and Fixed Cost functions. Pay attention to the shape of the curves, where they intercept the axes and each other (if they do), and the position of the curves relative to each other b) (9 points) Using...
 QUESTION 39 Price and cost MC ATC AVC N O P MR Demand RSTU Quantity (per period) The figure above shows different curves for a short-run monopolist. What is the profit-maximizing quantity level? OQ OR Os От Ου
Most questions answered within 3 hours.
-
lease solve all the
questions, don't need to explanations
Q1 - All animal
species have general...
asked 3 hours ago -
Business Phasing
1.Discuss the logical progression for growing a business, which
starts from the initial idea...
asked 3 hours ago -
Modify
When executing on the command line having only
this program name, the program will accept...
asked 4 hours ago -
Kenny Electric Company's noncallable bonds were issued several
years ago and now have 20 years to...
asked 5 hours ago -
find H(e^Jtheta) at theta= 0, pi/10, pi/20, pi/2 for
the following:
a) H(e^Jtheta)= 1+e^Jtheta
b) H(e^Jtheta)=...
asked 5 hours ago -
Home Corporation will open a new store on January 1. Based on
experience from its other...
asked 5 hours ago -
In a neoclassical model, use the IS-LM to analyze the effect of
a permanent money supply...
asked 6 hours ago -
An electron passes through a point 2.67 cm from a long straight
wire as it moves...
asked 7 hours ago -
A grammar is a 4-tuple G, G = (Ν, Σ, Π, Σ, S) where, Ν is...
asked 7 hours ago -
In this part, calculate the present values. Use the Excel PV
function to compute the present...
asked 7 hours ago -
Part 1. Primitive Types, Sorting, Recursion for
Homework.java
a) Implement the static method initializeArray that receives...
asked 8 hours ago -
Using C++, build a sorter that can rank a sequence of numbers in
a descending order....
asked 8 hours ago