The following data were collected on the height (inches) and weight (pounds) of women swimmers where...
The following data were collected on the height (inches) and
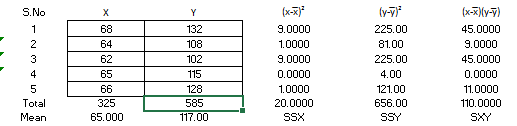
weight (pounds) of women swimmers where height is the independent
variable and weight is the dependent variable.
Height (x) = 68, 64, 62, 65, 66
Weight (y) = 132, 108, 102, 115, 128
a)Compute SSE, SST, and SSR
b)Compute the coefficient of determination r2. Comment on the goodness of fit.
c)Compute the sample correlation coefficient.
Homework Answers
a)
| SSE =Syy-(Sxy)2/Sxx= | 51.000 | |
| SST=Syy= | 656.0000 |
| SSR =(Sxy)2/Sxx = | 605.0000 | |
b)
| Coeffficient of determination R^2 =SSR/SST= | 0.9223 | ||
since R2 is very high, this tells us that values fit in the model very well
c)
| correlation coefficient r= | Sxy/(√Sxx*Syy) = | 0.9603 | |
Add Answer to:
The following data were collected on the height (inches) and
weight (pounds) of women swimmers where...
The following data give the percentage of women working in five companies in the retail and...
The following data give the percentage of women working in five companies in the retail and trade industry. The percentage of management jobs held by women is also shown. % Working 67 45 73 54 61 % Management 49 21 65 47 33 Compute SST, SSR, and SSE. Compute the coefficient of determination, r2. Comment on the goodness of fit. What is the value of the sample correlation coefficient?
The following data show the brand, price ($), and the overall score for 6 stereo headphones that were tested by Consume...
 The following data show the brand, price ($), and the overall score for 6 stereo headphones that were tested by Consumer Reports. The overall score is based on sound quality and effectiveness of ambient noise reduction. Scores range from 0 (lowest) to 100 (highest). The estimated regression equation for these data is û 24.9 +0.301c , where = price ($) and y overall score. Brand Price Score Bose 180 76 Scullcandy 150 71 Koss 95 62 Phillips/O'Neill 70 57 Denon...
The following data were collected on the height (inches) and weight (pounds) of 5 students. Height...
The following data were collected on the height (inches) and weight (pounds) of 5 students. Height 72 70 62 65 67 Weight 180 172 125 132 145 a. Develop a regression model to predict weight based on height. b. What percent of the total variation in weight has been explained by height? c. If a student is 69 inches tall, what would you estimate the weight to be? Please use the Excel Solver to solve the above exercise question
Given are five observations for two variables, x and y. 4 8 12 16 18 yi...
 Given are five observations for two variables, x and y. 4 8 12 16 18 yi 58 51 48 14 15 The estimated regression equation for these data is y= 76.77 - 3.41x a. Compute SSE, SST, and SSR (to 2 SSE decimals) (to 2 SST decimals) (to 2 SSR decimals) b. Compute the coefficient of determination r. Comment on the goodness of fit (to 3 decimals) % of the variability in y has been explained by the estimated regression...
A sales manager collected the following data on x = years of experience and y =...
A sales manager collected the following data on x = years of experience and y = annual sales ($1,000s). The estimated regression equation for these data is ŷ = 80 + 4x. Salesperson Years of Experience Annual Sales ($1,000s) 1 1 80 2 3 97 3 4 97 4 4 102 5 6 103 6 8 101 7 10 119 8 10 118 9 11 127 10 13 136 (a) Compute SST, SSR, and SSE. SST= SSR= SSE= (b) Compute...
A sales manager collected the following data on x = years of experience and y =...
 A sales manager collected the following data on x = years of experience and y = annual sales ($1,000s). The estimated regression equation for these data is ý = 81 + 4x. Salesperson Years of Experience Annual Sales ($1,000s) 1 107 103 101 119 8 9 10 10 11 13 123 127 136 (a) Compute SST, SSR, and SSE. SST = SSR = SSE = (b) Compute the coefficient of determination 2. (Round your answer to three decimal places.) 12...
The following data show the brand, price ($), and the overall score for 6 stereo headphones...
The following data show the brand, price ($), and the overall score for 6 stereo headphones that were tested by Consumer Reports. The overall score is based on sound quality and effectiveness of ambient noise reduction. Scores range from 0 (lowest) to 100 (highest). The estimated regression equation for these data is = 24.881 + 0.301 x, where x = price ($) and y = overall score. Brand Price ($) Score Bose 180 75 Scullcandy 160 72 Koss 95 61...
{Exercise 12.18 (Algorithmic)} The following data show the brand, price ($), and the overall score for...
{Exercise 12.18 (Algorithmic)} The following data show the brand, price ($), and the overall score for 6 stereo headphones that were tested by Consumer Reports. The overall score is based on sound quality and effectiveness of ambient noise reduction. Scores range from 0 (lowest) to 100 (highest). The estimated regression equation for these data is ŷ = 25.989 + 0.29x, where x = price ($) and y = overall score. Brand Price Score Bose 180 76 Scullcandy 150 71 Koss...
The following data show the brand, price , and the overall score for stereo headphones that...
The following data show the brand, price , and the overall score for stereo headphones that were tested by Consumer Reports. The overall score is based on sound quality and effectiveness of ambient noise reduction. Scores range from (lowest) to (highest). The estimated regression equation for these data is , where and . Brand Price Score Bose 180 75 Skullcandy 150 72 Koss 85 62 Phillips/O'Neill 70 56 Denon 60 30 JVC 55 35 Round your answers to three decimal...
The following data show the brand, price ($), and the overall score for 6 stereo headphones...
The following data show the brand, price ($), and the overall score for 6 stereo headphones that were tested by Consumer Reports. The overall score is based on sound quality and effectiveness of ambient noise reduction. Scores range from 0 (lowest) to 100 (highest). The estimated regression equation for these data is = 26.508 + 0.285 x, where x = price ($) and y = overall score. Brand Price ($) Score Bose 180 75 Scullcandy 160 71 Koss 95 61 Phillips/O'Neill...
 The following data show the brand, price ($), and the overall score for 6 stereo headphones that were tested by Consumer Reports. The overall score is based on sound quality and effectiveness of ambient noise reduction. Scores range from 0 (lowest) to 100 (highest). The estimated regression equation for these data is û 24.9 +0.301c , where = price ($) and y overall score. Brand Price Score Bose 180 76 Scullcandy 150 71 Koss 95 62 Phillips/O'Neill 70 57 Denon...
 Given are five observations for two variables, x and y. 4 8 12 16 18 yi 58 51 48 14 15 The estimated regression equation for these data is y= 76.77 - 3.41x a. Compute SSE, SST, and SSR (to 2 SSE decimals) (to 2 SST decimals) (to 2 SSR decimals) b. Compute the coefficient of determination r. Comment on the goodness of fit (to 3 decimals) % of the variability in y has been explained by the estimated regression...
 A sales manager collected the following data on x = years of experience and y = annual sales ($1,000s). The estimated regression equation for these data is ý = 81 + 4x. Salesperson Years of Experience Annual Sales ($1,000s) 1 107 103 101 119 8 9 10 10 11 13 123 127 136 (a) Compute SST, SSR, and SSE. SST = SSR = SSE = (b) Compute the coefficient of determination 2. (Round your answer to three decimal places.) 12...
Most questions answered within 3 hours.
-
Consider an hypothesis test of two means with a test statistic
t-stat = 0.78, a critical...
asked 4 minutes ago -
What is the final dilution of a sample after 3 successive 1:10
dilutions and two 1:100...
asked 4 minutes ago -
You are the CFO of a US manufacturer that exports to Thailand.
You have received spot...
asked 4 minutes ago -
List two to three qualities of the norovirus that make it so
infectious.
Only approximately 70%...
asked 11 minutes ago -
1a- A 140-gram glider on a horizontal, frictionless air track is
attached to a fixed ideal...
asked 25 minutes ago -
How is blood glucose concentration maintained at steady state
conditions?
please answer in text
asked 29 minutes ago -
a. Calculate price elasticity given the following information.
Is the curve elastic, inelastic or unitary elastic?...
asked 30 minutes ago -
Carlos learns how to cook from his mother. This is an example
of
a.
neither human...
asked 33 minutes ago -
On January 1, 2017, Nicks Corporation issued $250 million of
floating-rate debt. The debt carries a...
asked 1 hour ago -
If Mark is unable to see objects clearly when they are placed
beyond 0.5m away, (a)...
asked 1 hour ago -
Where there is no course of performance, usage of trade, or
course of dealing, and where...
asked 1 hour ago -
A piece of charcoal (essentially 100% carbon) from an
archaeological site in Egypt is subjected to...
asked 1 hour ago