At Community Hospital, the burn center is experimenting with a new plasma compress treatment. A random...
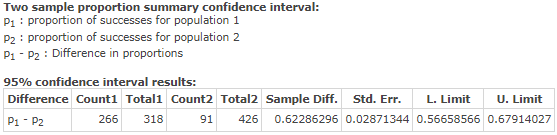
At Community Hospital, the burn center is experimenting with a new plasma compress treatment. A random sample of n1 = 318 patients with minor burns received the plasma compress treatment. Of these patients, it was found that 266 had no visible scars after treatment. Another random sample of n2 = 426 patients with minor burns received no plasma compress treatment. For this group, it was found that 91 had no visible scars after treatment. Let p1 be the population proportion of all patients with minor burns receiving the plasma compress treatment who have no visible scars. Let p2 be the population proportion of all patients with minor burns not receiving the plasma compress treatment who have no visible scars.
(a) Find a 95% confidence interval for p1 − p2. (Round your answers to three decimal places.)
| lower limit | |
| upper limit |
(b) Explain the meaning of the confidence interval found in part
(a) in the context of the problem. Does the interval contain
numbers that are all positive? all negative? both positive and
negative? At the 95% level of confidence, does treatment with
plasma compresses seem to make a difference in the proportion of
patients with visible scars from minor burns?
Because the interval contains both positive and negative numbers, we can not say that there is a higher proportion of patients with no visible scars among those who received the treatment.We can not make any conclusions using this confidence interval. Because the interval contains only negative numbers, we can say that there is a higher proportion of patients with no visible scars among those who did not receive the treatment.Because the interval contains only positive numbers, we can say that there is a higher proportion of patients with no visible scars among those who received the treatment
Homework Answers
The statistical software output for this problem is:
Hence,
a) 95% confidence interval:
Lower limit = 0.567
Upper limit = 0.679
b) Because the interval contains only positive numbers, we can say that there is a higher proportion of patients with no visible scars among those who received the treatment
Add Answer to:
At Community Hospital, the burn center is experimenting with a
new plasma compress treatment. A random...
At Community Hospital, the burn center is experimenting with a new plasma compress treatment. A random...
 At Community Hospital, the burn center is experimenting with a new plasma compress treatment. A random sample of n1-332 patients with minor burns received the plasma compress treatment. Of these patients, it was found that 250 had no visible scars after treatment. Another random sample of n2 428 patients with minor burns received no plasma compress treatment. For this group, it was found that 87 had no visible scars after treatment. Let p1 be the population proportion of all patients...
At Community Hospital, the burn center is experimenting with a new plasma compress treatment. A random...
At Community Hospital, the burn center is experimenting with a new plasma compress treatment. A random sample of n1 = 302 patients with minor burns received the plasma compress treatment. Of these patients, it was found that 256 had no visible scars after treatment. Another random sample of n2 = 416 patients with minor burns received no plasma compress treatment. For this group, it was found that 95 had no visible scars after treatment. Let p1 be the population proportion...
Most married couples have two or three personality preferences in common. A random sample of 366...
Most married couples have two or three personality preferences in common. A random sample of 366 married couples found that 138 had three preferences in common. Another random sample of 584 couples showed that 216 had two personality preferences in common. Let p1 be the population proportion of all married couples who have three personality preferences in common. Let p2 be the population proportion of all married couples who have two personality preferences in common. (a) Find a 99% confidence...
Most married couples have two or three personality preferences in common. A random sample of 388...
Most married couples have two or three personality preferences in common. A random sample of 388 married couples found that 120 had three preferences in common. Another random sample of 572 couples showed that 240 had two personality preferences in common. Let p1 be the population proportion of all married couples who have three personality preferences in common. Let p2 be the population proportion of all married couples who have two personality preferences in common. (a) Find a 95% confidence...
Most married couples have two or three personality preferences in common. A random sample of 379...
 Most married couples have two or three personality preferences in common. A random sample of 379 married couples found that 134 had three preferences in common. Another random sample of 573 couples showed that 215 had two personality preferences in common. Let Pi be the population proportion of all married couples who have three personality preferences in common. Let p2 be the population proportion of all married couples who have two personality preferences in common. (a) Find a 90% confidence...
A study considered the question, 'Are you a registered voter?" Accuracy of response was confirmed by...
 A study considered the question, 'Are you a registered voter?" Accuracy of response was confirmed by a check of city voting records. Two methods of survey were used: a face-to-face interview and a telephone interview. A random sample of 85 people were asked the voter registration question face to face. Of those sampled, seventy-six respondents gave accurate answers (as verified by city records). Another random sample of 90 people were asked the same question during a telephone interview. Of those...
From public records, individuals were identified as having been charged with drunken driving not less than...
From public records, individuals were identified as having been charged with drunken driving not less than 6 months or more than 12 months from the starting date of the study. Two random samples from this group were studied. In the first sample of 26 individuals, the respondents were asked in a face-to-face interview if they had been charged with drunken driving in the last 12 months. Of these 26 people interviewed face to face, 10 answered the question accurately. The...
From public records, individuals were identified as having been charged with drunken driving not less than...
 From public records, individuals were identified as having been charged with drunken driving not less than 6 months or more than 12 months from the starting date of the study. Two random samples from this group were studied. In the first sample of 30 individuals, the respondents were asked in a face-to-face interview if they had been charged with drunken driving in the last 12 months. Of these 30 people interviewed face to face, 17 answered the question accurately. The...
A random sample of 366 married couples found that 298 had two or more personality preferences...
A random sample of 366 married couples found that 298 had two or more personality preferences in common. In another random sample of 574 married couples, it was found that only 22 had no preferences in common. Let p1 be the population proportion of all married couples who have two or more personality preferences in common. Let p2 be the population proportion of all married couples who have no personality preferences in common. (a) Find a 99% confidence interval for...
A random sample of 24 wolf litters in Ontario, Canada, gave an average of x1 =...
A random sample of 24 wolf litters in Ontario, Canada, gave an average of x1 = 4.4 wolf pups per litter, with estimated sample standard deviation s1 = 1.0. Another random sample of 11 wolf litters in Finland gave an average of x2 = 2.8 wolf pups per litter, with sample standard deviation s2 = 1.3. (a) Categorize the problem below according to parameter being estimated, proportion p, mean μ, difference of means μ1 – μ2, or difference of proportions...
 At Community Hospital, the burn center is experimenting with a new plasma compress treatment. A random sample of n1-332 patients with minor burns received the plasma compress treatment. Of these patients, it was found that 250 had no visible scars after treatment. Another random sample of n2 428 patients with minor burns received no plasma compress treatment. For this group, it was found that 87 had no visible scars after treatment. Let p1 be the population proportion of all patients...
 Most married couples have two or three personality preferences in common. A random sample of 379 married couples found that 134 had three preferences in common. Another random sample of 573 couples showed that 215 had two personality preferences in common. Let Pi be the population proportion of all married couples who have three personality preferences in common. Let p2 be the population proportion of all married couples who have two personality preferences in common. (a) Find a 90% confidence...
 A study considered the question, 'Are you a registered voter?" Accuracy of response was confirmed by a check of city voting records. Two methods of survey were used: a face-to-face interview and a telephone interview. A random sample of 85 people were asked the voter registration question face to face. Of those sampled, seventy-six respondents gave accurate answers (as verified by city records). Another random sample of 90 people were asked the same question during a telephone interview. Of those...
 From public records, individuals were identified as having been charged with drunken driving not less than 6 months or more than 12 months from the starting date of the study. Two random samples from this group were studied. In the first sample of 30 individuals, the respondents were asked in a face-to-face interview if they had been charged with drunken driving in the last 12 months. Of these 30 people interviewed face to face, 17 answered the question accurately. The...
Most questions answered within 3 hours.
-
Little’s Law: Val d’Costa is a world famous ski village in the
French Alps. Because of...
asked 21 minutes ago -
Find the absolute error D for the calculation if A + B/C=D A=
9.4 +/- 0.4...
asked 34 minutes ago -
New Air Heating and Cooling, manufactures furnaces and central
air units. The company pride itself on...
asked 48 minutes ago -
A coach uses a new technique to train gymnasts. Seven
gymnasts were randomly selected and their...
asked 2 hours ago -
While rotating the tires on your car you notice a rock [mass =
0.1 Kg] stuck...
asked 4 hours ago -
Using MARS simulator, write MIPS programs according to
the following scenarios: Receive a positive integer number...
asked 6 hours ago -
An object in front of a concave mirror has a real image that is
11.5 cm...
asked 6 hours ago -
Consider the reaction, C3 H8 + O2 --> CO2 + H2O. How many
moles of O2...
asked 8 hours ago -
You and your opponent both roll a fair die. If you both roll the
same number,...
asked 8 hours ago -
In a study of the accuracy of fast food drive-through orders,
Restaurant A had 257 accurate...
asked 8 hours ago -
Identify and describe in detail the four categories of
institutions that could be included in a...
asked 8 hours ago -
In python
class Customer:
def __init__(self, customer_id, last_name, first_name, phone_number, address):
self._customer_id = int(customer_id)
self._last_name =...
asked 9 hours ago