A cruise ship was carrying 3,711 passengers on January 25th. A passenger showing symptoms of a...
A cruise ship was carrying 3,711 passengers on January 25th. A passenger showing symptoms of a virus departed the ship in Hong Kong and was tested for the virus. Testing confirmed he had the infection. On February 5th passengers were quarantined in their cabins on the ship. Ultimately 712 passengers tested positive for the virus and 8 passengers with the virus died.
Part 1: Identify the sample size, number of infections, infection rate, number of deaths, and death rate on the Cruise ship.
Part 2: Assuming the cruise ship is a subset of a population, use the cruise ship data to create a 95% Confidence Interval for the proportion of people you’d expect to contract the virus and for the proportion of people you’d expect to die from it.
Homework Answers
Part-1:
In case of infection,
Sample size 
Number of infections 
Infection rate is given by

In case of death,
Sample size 
Number of deaths 
Death rate is given by

Part-2:
Corresponding statistic is given by

Infection proportion-
We know,

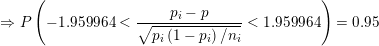


So, 95% confidence interval of proportion of people we would
expect to contract the virus is  .
.
Death proportion-
We know,


So, 95% confidence interval of proportion of people we would
expect to die due to the virus is  .
.
Add Answer to:
A cruise ship was carrying 3,711 passengers on January 25th. A
passenger showing symptoms of a...
The one situation where an entire, closed population was tested was the Diamond Princess cruise ship...
The one situation where an entire, closed population was tested was the Diamond Princess cruise ship and its quarantine passengers. The case fatality rate there was 1.0%, but this was a largely elderly population, in which the death rate from Covid-19 is much higher. Projecting the Diamond Princess mortality rate onto the age structure of the U.S. population, the death rate among people infected with Covid-19 would be 0.125%. But since this estimate is based on extremely thin data —...
Most questions answered within 3 hours.
-
3. Describe the “logic circuit” of the Lac operon. Which
proteins are bound or not to...
asked 23 seconds ago -
Ayesha’s adjusted gross income is $60,000 in 2019. She donated a
piece of artwork with a...
asked 7 minutes ago -
For Dijkstra’s shortest path algorithm:
a. Give the Big-O time for Dijkstra’s shortest path algorithm
and...
asked 19 minutes ago -
Phosphorus violates the 'octet rule' in biological molecules,
forming more covalent bonds than expected based on...
asked 22 minutes ago -
A 1.3 eV electron has a 10-4 probability of tunneling
through a 2.4 eV potential barrier....
asked 40 minutes ago -
What is the one ingredient that is common to being successful
with all stakeholders?
profit
trust...
asked 39 minutes ago -
Write an assembly language 32 bit program that reads in lines of
text by a .txt...
asked 42 minutes ago -
what is the density ( in g/L) of hydrogen gas at 29 degrees C and a...
asked 51 minutes ago -
5-6. You are considering three investment alternatives for some
spare cash: Old Reliable Corporation stock (A1),...
asked 42 minutes ago -
Problem 16-02
Receivables Investment
Medwig Corporation has a DSO of 45 days. The company averages
$7,250...
asked 57 minutes ago -
Mr. Brown hired Lowe's Maintenance Services Limited to repair
and paint the exterior wall of his...
asked 58 minutes ago -
When might an index slow down the overall performance of the
database? Choose the best answer....
asked 1 hour ago