1. What easily identified type of vibration(s) (give functional group and approximate expected frequency) would be...
1. What easily identified type of vibration(s) (give functional group and approximate expected frequency) would be present in the IR spectrum of the isobutyraldehyde reactant but not in the product 2-methyl-3-heptanol, allowing the compounds to be distinguished?
2. What easily identified type of vibration(s) (give functional group approximate expected frequency) would be present in the IR spectrum of 2-methyl-3-heptanol but not in either of the reactants, allowing the compounds to be distinguished?
3. Does the IR spectrum of the example student sample show product and, if so, is it relatively pure (how conclusive is the spectrum? does it show the product peak identified in question 2 above and/or the reactant peak identified in question 1 above?)
4. identify how many peaks are expected in the 13C-NMR for the 2-methyl-3-heptanol product and explain your reasoning, ie. identify mirror planes or rotations that exchange equivalent carbons.
Homework Answers
1. As isobutyraldehyde is an adlehyde having carbonyl (C=O) stretching vibrations frequency at around 1700 cm-1 which is absent in the product 2-methyl-3-heptanol. The product is an alcohol which has O-H stretching frequency between 3300-3500 cm-1 which is absent in the product. So, these easily identified type of vibration(s) allow the compounds to be distinguished.

2. One of the reactants is isobutyraldehyde which is an aldehyde and the other one is butyl bromide which is a bromoalkane. The product is 2-methyl-3-heptanol and has hydroxyl group which is absent in both of the reactants. The O-H stretching frequency is observed between 3300-3500 cm-1.
So, O-H stretching frequency observed in the 3300-3500 cm-1 is easily identified type of vibration is present in the IR spectrum of 2-methyl-3-heptanol but not in either of the reactants, allowing the compounds to be distinguished

3. The IR spectrum of the example student sample show product, its purity should be known by matching of the mentioned frequencies in the spectrum of the samples.
4. The number of peaks expected in the 13C-NMR for the 2-methyl-3-heptanol product = number of magnetically non equivalent carbon atoms = 7
So, the number of peaks expected in the 13C-NMR for the 2-methyl-3-heptanol product is seven.
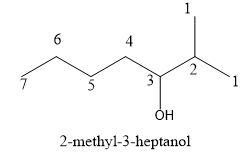
The mirror planes or rotations that exchange equivalent carbons (1) are the ones passing between the carbon atoms 2 and 3.
Add Answer to:
1. What easily identified type of
vibration(s) (give functional group and approximate expected
frequency) would be...
Chem 210 Report - IR Spectroscopy Name: ID: 1) For the functional group(s) on the following...
Chem 210 Report - IR Spectroscopy Name: ID: 1) For the functional group(s) on the following molecule what characteristic IR absorption(s) would be expected (ignoring C-H absorptions). A) a peak around 1700 cm–1 B) a peak around 3300 cm–1 C) a peak around 1650 cm–1 D) a peak around 2250 cm–1 E) None of these choices Answer: 2) An oxygen-containing compound shows strong IR absorption at 1630-1780 cm–1 and 3200-3550 –1 cm . What type of compound is it likely...
IR Worksheet 1. For each spectrum below: 1) Label the major peaks with their approximate frequency....
 IR Worksheet 1. For each spectrum below: 1) Label the major peaks with their approximate frequency. 2) Identify the bond vibration and possible functional group associated with each peak. 3) Match the spectra to one of these possible compounds: NH2 TRANSMITTANCE[%] pobo edo "2060 bo zdoo 160 Tobo 560 WAVENUMBER [cm-1] oot 08 TRANSMITTANCE [%] 09 01 02 4000 3500 3000 2500 2000 WAVENUMBER (cm-1] 1500 1000 500 οοο TRANSMITTANCE (6) οο οο οε 4000 3500 3000 1500 1000 2500...
1. shown below are IR spectra of cyclohexanecarbaldehyde (I) and cyclohexene (II). which of the spectra...
 1. shown below are IR spectra of cyclohexanecarbaldehyde (I)
and cyclohexene (II). which of the spectra A and B corresponds to
which structure (I or II)? On each spectrum identify the peaks that
are associated with a specific bond vibration bond by drawing the
functional group for that bond, circling the specific vibrating
bond and drying and arrow from the circled bond to the absorption
peak. include all the C-H bonds.
2. provided below are IR spectra of
1,2,3,6-tetrahydrobenzaldehyde (I)...
1. shown below are IR spectra of cyclohexanecarbaldehyde (I)
and cyclohexene (II). which of the spectra A and B corresponds to
which structure (I or II)? On each spectrum identify the peaks that
are associated with a specific bond vibration bond by drawing the
functional group for that bond, circling the specific vibrating
bond and drying and arrow from the circled bond to the absorption
peak. include all the C-H bonds.
2. provided below are IR spectra of
1,2,3,6-tetrahydrobenzaldehyde (I)...
Fall 2019 3) For the functional group(s) on the following molecule, what characteri would be expected...
 Fall 2019 3) For the functional group(s) on the following molecule, what characteri would be expected (ignoring C-H absorptions)? characteristic IR absorptions) A) peaks around 3300, 2150, and 1650 cm B) peaks around 1710 and 1650 cm! C) peaks around 1650 and 3300 cm-' D) a peak around 2250 and 3300 cm! E) None of these choices.
FULL NMR REPORT HELP PLEASE 1 Chemical Environment: 1 How many individual H-NMR signals would you...
 FULL NMR REPORT HELP PLEASE
1 Chemical Environment: 1 How many individual H-NMR signals would you expect for each molecule? OH НО, propanol isopropanol diethyl ether OH bromobutane ethanol ethyl methyl ketone benzene methyl benzene benzophenone 1b) What is the expected Integration Number for each signal? benzene ethanol ethyl methyl ketone 1 Chemical Environment: 1 How many individual H-NMR signals would you expect for each molecule? no Somo propanol isopropanol diethyl ether OH bromobutane ethanol ethyl methyl ketone benzene methyl...
FULL NMR REPORT HELP PLEASE
1 Chemical Environment: 1 How many individual H-NMR signals would you expect for each molecule? OH НО, propanol isopropanol diethyl ether OH bromobutane ethanol ethyl methyl ketone benzene methyl benzene benzophenone 1b) What is the expected Integration Number for each signal? benzene ethanol ethyl methyl ketone 1 Chemical Environment: 1 How many individual H-NMR signals would you expect for each molecule? no Somo propanol isopropanol diethyl ether OH bromobutane ethanol ethyl methyl ketone benzene methyl...
3. the followong compound has a molecular formula of C6H10O2 and has two stronf syretching bibration peaks in its FTIR spectrum at 1725 and 1200cm-1 giving rise to a specific functional group. what i...
 3. the followong compound has a molecular formula of C6H10O2
and has two stronf syretching bibration peaks in its FTIR spectrum
at 1725 and 1200cm-1 giving rise to a specific functional group.
what is this molecule.
4. based on the mass spectrum below-which heteratom (S, Br,
Cl) is present in the molecule that produces this spectrum?
5. which functional group is present in the molecule that
produces the followong IR spectra?
please answer questions 3-5
Verizon 7:24 PM 3 of...
3. the followong compound has a molecular formula of C6H10O2
and has two stronf syretching bibration peaks in its FTIR spectrum
at 1725 and 1200cm-1 giving rise to a specific functional group.
what is this molecule.
4. based on the mass spectrum below-which heteratom (S, Br,
Cl) is present in the molecule that produces this spectrum?
5. which functional group is present in the molecule that
produces the followong IR spectra?
please answer questions 3-5
Verizon 7:24 PM 3 of...
2. (2 pts.) Provided below are IR spectra of 1,2,3,6-tetrahydrobenzaldehyde (I) and 3-methyl-2-cyclohexen-1-one (II). Decide which...
 2. (2 pts.) Provided below are IR spectra of 1,2,3,6-tetrahydrobenzaldehyde (I) and 3-methyl-2-cyclohexen-1-one (II). Decide which of the IR spectra A and B corresponds to which structure (I or II). On each spectrum, identify the peaks that are associated with a specific bond vibration bond by drawing the functional group for that bond, circling the specific vibrating bond and drawing an arrow from the circled bond to the absorption peak, as appropriate. Include all the C-H bonds. odo and II...
2. What part of the electromagnetic spectrum (wavelength range) occupies the infrared region and from it...
2. What part of the electromagnetic spectrum (wavelength range) occupies the infrared region and from it which specific range is used with the organic molecules. ? 3. In general, how do you compare the radiations of IR with UV, X-ray and microwave radiation in terms of energy? Organize in increasing order. 4. What causes exposure or proximity in humans: a) to an IR lamp, b) spending an hour under the sun, c) taking a plate with X-rays or obtaining an...
Tools Window Help OMX 75% Esterification Experiment Lab Data.pdf (page 1 of 3) Search Product Ester...
 Tools Window Help OMX 75% Esterification Experiment Lab Data.pdf (page 1 of 3) Search Product Ester IR of starting alcohol (1-pentanol) 1-Pentanol M. AM 19ra aromo 14, 2017 m. 1% 1075 20 . 2030 26.1.60.39 10 4000 3500 . 1000 3000 INT 650 2500 cm-1 2000 1500 M 8 Tools Window Help 78 Wed 2:19 PM Go Esterification Experiment Lab Data pdf page 2 of 3) @ Q Search IR of final product (ester) Product Ester Guided Instructions for In-Lab...
Please identify all relevant peaks in both the IR and NMR for methyl 3-nitrobenzoate, please use...
 Please identify all relevant peaks in both the IR and NMR for
methyl 3-nitrobenzoate, please use the following chart as a
template, thank you!
Spectral Database for Organic Compounds SDBS Japanese Introduction Disclaimer HELP Contact What's New RIO-DB FAQ LINK . AIST SDBS-H NMRSDBS No. 3528HSP-49-719 Cg H7 N04 methyl m-nitrobenzoate 399.65 MHz 0.038 g: 0.5 ml CDC13 9 8 7 6 4 3 2 1 5 ppm HSP-49-719 {AH 1 0 —CH, (E) ON -H (C) (BH HID) Spectral...
Please identify all relevant peaks in both the IR and NMR for
methyl 3-nitrobenzoate, please use the following chart as a
template, thank you!
Spectral Database for Organic Compounds SDBS Japanese Introduction Disclaimer HELP Contact What's New RIO-DB FAQ LINK . AIST SDBS-H NMRSDBS No. 3528HSP-49-719 Cg H7 N04 methyl m-nitrobenzoate 399.65 MHz 0.038 g: 0.5 ml CDC13 9 8 7 6 4 3 2 1 5 ppm HSP-49-719 {AH 1 0 —CH, (E) ON -H (C) (BH HID) Spectral...
 IR Worksheet 1. For each spectrum below: 1) Label the major peaks with their approximate frequency. 2) Identify the bond vibration and possible functional group associated with each peak. 3) Match the spectra to one of these possible compounds: NH2 TRANSMITTANCE[%] pobo edo "2060 bo zdoo 160 Tobo 560 WAVENUMBER [cm-1] oot 08 TRANSMITTANCE [%] 09 01 02 4000 3500 3000 2500 2000 WAVENUMBER (cm-1] 1500 1000 500 οοο TRANSMITTANCE (6) οο οο οε 4000 3500 3000 1500 1000 2500...
 1. shown below are IR spectra of cyclohexanecarbaldehyde (I)
and cyclohexene (II). which of the spectra A and B corresponds to
which structure (I or II)? On each spectrum identify the peaks that
are associated with a specific bond vibration bond by drawing the
functional group for that bond, circling the specific vibrating
bond and drying and arrow from the circled bond to the absorption
peak. include all the C-H bonds.
2. provided below are IR spectra of
1,2,3,6-tetrahydrobenzaldehyde (I)...
1. shown below are IR spectra of cyclohexanecarbaldehyde (I)
and cyclohexene (II). which of the spectra A and B corresponds to
which structure (I or II)? On each spectrum identify the peaks that
are associated with a specific bond vibration bond by drawing the
functional group for that bond, circling the specific vibrating
bond and drying and arrow from the circled bond to the absorption
peak. include all the C-H bonds.
2. provided below are IR spectra of
1,2,3,6-tetrahydrobenzaldehyde (I)...
 Fall 2019 3) For the functional group(s) on the following molecule, what characteri would be expected (ignoring C-H absorptions)? characteristic IR absorptions) A) peaks around 3300, 2150, and 1650 cm B) peaks around 1710 and 1650 cm! C) peaks around 1650 and 3300 cm-' D) a peak around 2250 and 3300 cm! E) None of these choices.
 FULL NMR REPORT HELP PLEASE
1 Chemical Environment: 1 How many individual H-NMR signals would you expect for each molecule? OH НО, propanol isopropanol diethyl ether OH bromobutane ethanol ethyl methyl ketone benzene methyl benzene benzophenone 1b) What is the expected Integration Number for each signal? benzene ethanol ethyl methyl ketone 1 Chemical Environment: 1 How many individual H-NMR signals would you expect for each molecule? no Somo propanol isopropanol diethyl ether OH bromobutane ethanol ethyl methyl ketone benzene methyl...
FULL NMR REPORT HELP PLEASE
1 Chemical Environment: 1 How many individual H-NMR signals would you expect for each molecule? OH НО, propanol isopropanol diethyl ether OH bromobutane ethanol ethyl methyl ketone benzene methyl benzene benzophenone 1b) What is the expected Integration Number for each signal? benzene ethanol ethyl methyl ketone 1 Chemical Environment: 1 How many individual H-NMR signals would you expect for each molecule? no Somo propanol isopropanol diethyl ether OH bromobutane ethanol ethyl methyl ketone benzene methyl...
 3. the followong compound has a molecular formula of C6H10O2
and has two stronf syretching bibration peaks in its FTIR spectrum
at 1725 and 1200cm-1 giving rise to a specific functional group.
what is this molecule.
4. based on the mass spectrum below-which heteratom (S, Br,
Cl) is present in the molecule that produces this spectrum?
5. which functional group is present in the molecule that
produces the followong IR spectra?
please answer questions 3-5
Verizon 7:24 PM 3 of...
3. the followong compound has a molecular formula of C6H10O2
and has two stronf syretching bibration peaks in its FTIR spectrum
at 1725 and 1200cm-1 giving rise to a specific functional group.
what is this molecule.
4. based on the mass spectrum below-which heteratom (S, Br,
Cl) is present in the molecule that produces this spectrum?
5. which functional group is present in the molecule that
produces the followong IR spectra?
please answer questions 3-5
Verizon 7:24 PM 3 of...
 2. (2 pts.) Provided below are IR spectra of 1,2,3,6-tetrahydrobenzaldehyde (I) and 3-methyl-2-cyclohexen-1-one (II). Decide which of the IR spectra A and B corresponds to which structure (I or II). On each spectrum, identify the peaks that are associated with a specific bond vibration bond by drawing the functional group for that bond, circling the specific vibrating bond and drawing an arrow from the circled bond to the absorption peak, as appropriate. Include all the C-H bonds. odo and II...
 Tools Window Help OMX 75% Esterification Experiment Lab Data.pdf (page 1 of 3) Search Product Ester IR of starting alcohol (1-pentanol) 1-Pentanol M. AM 19ra aromo 14, 2017 m. 1% 1075 20 . 2030 26.1.60.39 10 4000 3500 . 1000 3000 INT 650 2500 cm-1 2000 1500 M 8 Tools Window Help 78 Wed 2:19 PM Go Esterification Experiment Lab Data pdf page 2 of 3) @ Q Search IR of final product (ester) Product Ester Guided Instructions for In-Lab...
 Please identify all relevant peaks in both the IR and NMR for
methyl 3-nitrobenzoate, please use the following chart as a
template, thank you!
Spectral Database for Organic Compounds SDBS Japanese Introduction Disclaimer HELP Contact What's New RIO-DB FAQ LINK . AIST SDBS-H NMRSDBS No. 3528HSP-49-719 Cg H7 N04 methyl m-nitrobenzoate 399.65 MHz 0.038 g: 0.5 ml CDC13 9 8 7 6 4 3 2 1 5 ppm HSP-49-719 {AH 1 0 —CH, (E) ON -H (C) (BH HID) Spectral...
Please identify all relevant peaks in both the IR and NMR for
methyl 3-nitrobenzoate, please use the following chart as a
template, thank you!
Spectral Database for Organic Compounds SDBS Japanese Introduction Disclaimer HELP Contact What's New RIO-DB FAQ LINK . AIST SDBS-H NMRSDBS No. 3528HSP-49-719 Cg H7 N04 methyl m-nitrobenzoate 399.65 MHz 0.038 g: 0.5 ml CDC13 9 8 7 6 4 3 2 1 5 ppm HSP-49-719 {AH 1 0 —CH, (E) ON -H (C) (BH HID) Spectral...
Most questions answered within 3 hours.
-
The average length of time between arrivals at a turnpike
toll-booth is 26 seconds. What is...
asked 1 hour ago -
(a) A piston at 6.1 atm contains a gas that occupies a volume of
3.5 L....
asked 2 hours ago -
Please answer true or false. Words
cannot be changed or added in to make it true...
asked 2 hours ago -
An empty test tube weighs 15.923 grams. Then,
MgCl2•6H2O is added into the test tube. After...
asked 2 hours ago -
Assume memory access is 10 units of time and disk access is
10000 units of time....
asked 2 hours ago -
1. Are all good samples random?
2. Magazines often report surveys giving statistics such as “63%...
asked 2 hours ago -
Under all the various types of market structures, firms
must eventually earn some economic profits for...
asked 2 hours ago -
Consider the following fitness regime for a single locus trait
with two co-dominant alleles: w11 =...
asked 2 hours ago -
A large cable company reports the following.
80% of its customers subscribe to its cable TV...
asked 3 hours ago -
Please answer the question in brief.
Discuss the role of ERP in organizations. Are ERP tools...
asked 2 hours ago -
Discuss the pros and cons of collaborative software such
as SameTime. Does it increase productivity? What...
asked 3 hours ago -
Buying your in-laws a gift because it’s expected is
due to the ____________ motive of gift-giving....
asked 3 hours ago