2. Assume a pharmaceutical company invented a drug that is more effective in treating (or at...
2. Assume a pharmaceutical company invented a drug that is more effective in treating (or at least life extending) blood cancers and managed to obtain a patent on the drug making the company the sole provider of this blood cancer drug in the market for the next 30 years. Assume in the long-run (i.e.,in 30 years) as the patent expires, given a perfectly elastic long-run supply in the long-run, the competitive price becomes Pc, which also represents the industry’s marginal cost (MC) and average cost (AC). Assume a typical downward sloping market demand curve and the corresponding marginal revenue curve likely to prevail in a market characterized by monopoly. (20points-each part 5 points)
a) Draw a diagram with P on the y-axis and Q on the x-axis for the market for this drug. Draw the demand curve and the corresponding marginal revenue curve. Show the industry (i.e. firm in the short-run) MC=AC=Pc (long-run competitive price) on the diagram. Show the long-run competitive quantity (Qc) on the diagram.
b) Show the monopolistic firm’s profit maximizing output level (Qm) and the corresponding price level (Pm) on the diagram drawn in part a. Show the area that represents the welfare loss from monopoly on the diagram drawn in part a. Explain why this area represents welfare loss.
c) Assume the government established a maximum price of Pr where Pm>Pr>Pc. Show the Qr, the output produced under this government regulation, on the diagram drawn in part a. Assuming no complications in interventions as in government failure, would this price control help reduce welfare loss? Why or why not?
d) Is there still welfare loss under price regulation with a price of Pr? If no, explain why not. If yes, show the area of welfare loss on the diagram drawn in part a and compare welfare loss under Pr to welfare loss under Pm.
Homework Answers
a. The long run competitive equilibrium is given by P=MC and the competitive price and quantity are shown below in the diagram.

b. The monopolist equilibrium is determined at MR=MC. monopolist profit maximizing price,Pm and quantity,Qm are shown in the diagram below. The welfare loss due to monopoly is shown by the area of triangle abc. This is because monopolist sells less quantity at a higher price as compared to the perfect competition.

c. When government sets the price ceiling at Pr, the corresponding output is Qr. This price control helps to reduce the welfare loss by area abed. This is because the Pr is lower than than Pm, while Qr is higher than Qm. Thus, consumers are now getting more quantity of drugs at a lower price.
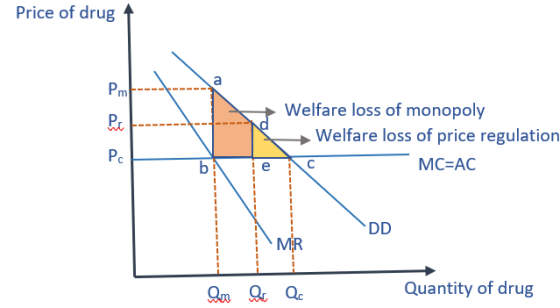
d. Even after price regulation,there is still welfare loss of area of triangle dec as shown in figure. This is because Pr is still higher than Pc and Qr is lower than Qc. Thus, consumers are paying more price for lesser quantity,resulting in loss of consumer surplus. At the competitive equilibrium,there is no welfare loss.
Add Answer to:
2. Assume a pharmaceutical company invented a drug that is more
effective in treating (or at...
Assume that one of the hot dog vendors successfully lobbies the city council to obtain the...
 Assume that one of the hot dog vendors successfully lobbies the city council to obtain the exclusive right to sell hot dogs within the city limits. This firm buys up all the rest of the hot dog vendors in the city and operates as a monopoly. Assume that this change doesn't affect demand and that the new monopoly's marginal-cost curve corresponds exactly to the supply curve on the previous graph. Under this assumption, the following graph shows the demand (D),...
Answer these with thorough explanations, please! 5. Monopoly outcome versus competition outcome Consider the daily market...
 Answer these with thorough explanations, please!
5. Monopoly outcome versus competition outcome Consider the daily market for hot dogs in a small city. Suppose that this market is in long-run competitive equilibrium with many hot dog stands in city, each one selling the same kind of hot dogs. Therefore, each vendor is a price taker and possesses no market power. The following graph shows the demand (D) and supply (S = MC) curves in the market for hot dogs. Place...
Answer these with thorough explanations, please!
5. Monopoly outcome versus competition outcome Consider the daily market for hot dogs in a small city. Suppose that this market is in long-run competitive equilibrium with many hot dog stands in city, each one selling the same kind of hot dogs. Therefore, each vendor is a price taker and possesses no market power. The following graph shows the demand (D) and supply (S = MC) curves in the market for hot dogs. Place...
Place the black point (plus symbol) on the following graph to indicate the profit- maximising price...
 Place the black point (plus symbol) on the following graph to indicate the profit- maximising price and quantity of a monopolist. 5. Monopoly outcome versus competition outcome Consider the daily market for hot dogs in a small city. Imagine that this market is in long-run competitive equilibrium with many hot dog stands in the city, each one selling the same kind of hot dogs. Therefore, each vendor is a price taker and possesses no market power Monopaly Outcome The following...
5. Monopoly outcome versus competition outcome Consider the daily market for hot dogs in a small...
 5. Monopoly outcome versus competition outcome Consider the daily market for hot dogs in a small city. Suppose that this market is in long-run competitive equilibrium with many hot dog stands in the city, each one selling the same kind of hot dogs. Therefore, each vendor is a price taker and possesses no market power. The following graph shows the demand (D) and supply (S = MC) curves in the market for hot dogs. Place the black point (plus symbol) on the graph...
Competitive market or monopoly for both drop down menus. 5. Monopoly outcome versus competition outcome Consider...
 Competitive market or monopoly for both drop down
menus.
5. Monopoly outcome versus competition outcome Consider the daily market for hot dogs in a small city. Suppose that this market is in long-run competitive equilibrium with many hot dog stands in the city, each one selling the same kind of hot dogs. Therefore, each vendor is a price taker and possesses no market power. The following graph shows the demand (D) and supply (S MC) curves in the market for...
Competitive market or monopoly for both drop down
menus.
5. Monopoly outcome versus competition outcome Consider the daily market for hot dogs in a small city. Suppose that this market is in long-run competitive equilibrium with many hot dog stands in the city, each one selling the same kind of hot dogs. Therefore, each vendor is a price taker and possesses no market power. The following graph shows the demand (D) and supply (S MC) curves in the market for...
We were unable to transcribe this imageNow, assume that one of the hot dog stands successfully lobbies the city council to obtain the exclusive right to sell hot dogs within the city limits. This fir...
 We were unable to transcribe this imageNow, assume that one of the hot dog stands successfully lobbies the city council to obtain the exclusive right to sell hot dogs within the city limits. This firm buys up all the rest of the hot dog stands in the city and operates as a monopoly. Assume that this change doesn't affect demand and that the new monopoly's marginal cost curve corresponds exactly to the supply curve on the previous graph. Under this...
5. Monopoly outcome versus competition outcome Consider the daily market for hot dogs in a small...
 5. Monopoly outcome versus competition outcomeConsider the daily market for hot dogs in a small city. Suppose that this market is in long-run competitive equilibrium with many hot dog stands in the city, each one selling the same kind of hot dogs. Therefore, each vendor is a price taker and possesses no market power.The following graph shows the demand (D) and supply (S = MC) curves in the market for hot dogs.Place the black point (plus symbol) on the graph...
5. Monopoly outcome versus competition outcome Consider thedaily market for hot dogs in a small...
 5. Monopoly outcome versus competition outcome Consider the
daily market for hot dogs in a small city. Suppose that this market
is in long-run competitive equilibrium with many hot dog stands in
the city, each one selling the same kind of hot dogs. Therefore,
each vendor is a price taker and possesses no market power. The
following graph shows the demand (D) and supply curves (S = MC) in
the market for hot dogs. Place the black point (plus symbol) on...
5. Monopoly outcome versus competition outcome Consider the
daily market for hot dogs in a small city. Suppose that this market
is in long-run competitive equilibrium with many hot dog stands in
the city, each one selling the same kind of hot dogs. Therefore,
each vendor is a price taker and possesses no market power. The
following graph shows the demand (D) and supply curves (S = MC) in
the market for hot dogs. Place the black point (plus symbol) on...
5. Monopoly outcome versus competition outcome sider the daily market for hot dogs in a small...
 5. Monopoly outcome versus competition outcome sider the daily market for hot dogs in a small city. Suppose that this market is in long-run competitive equilibrium, with many hot dog stands in he city, each one selling the same kind of hot dogs. Therefore, each vendor is a price taker and possesses no market power. The following graph shows the demand (D) and supply curves (S MC) in the market for hot dogs Place the black point (plus symbol) on...
CENGAGE | MINDTAP Aplia Homework: Monopoly 5. Monopoly outcome versus competition outcome Consider the daily market...
 CENGAGE | MINDTAP Aplia Homework: Monopoly 5. Monopoly outcome versus competition outcome Consider the daily market for hot dogs in a small city. Suppose that this market is in long-run competitive equilibrium, with many hot dog stands in the city, each one selling the same kind of hot dogs. Therefore, each vendor is a price taker and possesses no market power. The following graph shows the demand (D) and supply curves (S - MC) in the market for hot dogs....
 Assume that one of the hot dog vendors successfully lobbies the city council to obtain the exclusive right to sell hot dogs within the city limits. This firm buys up all the rest of the hot dog vendors in the city and operates as a monopoly. Assume that this change doesn't affect demand and that the new monopoly's marginal-cost curve corresponds exactly to the supply curve on the previous graph. Under this assumption, the following graph shows the demand (D),...
 Answer these with thorough explanations, please!
5. Monopoly outcome versus competition outcome Consider the daily market for hot dogs in a small city. Suppose that this market is in long-run competitive equilibrium with many hot dog stands in city, each one selling the same kind of hot dogs. Therefore, each vendor is a price taker and possesses no market power. The following graph shows the demand (D) and supply (S = MC) curves in the market for hot dogs. Place...
Answer these with thorough explanations, please!
5. Monopoly outcome versus competition outcome Consider the daily market for hot dogs in a small city. Suppose that this market is in long-run competitive equilibrium with many hot dog stands in city, each one selling the same kind of hot dogs. Therefore, each vendor is a price taker and possesses no market power. The following graph shows the demand (D) and supply (S = MC) curves in the market for hot dogs. Place...
 Place the black point (plus symbol) on the following graph to indicate the profit- maximising price and quantity of a monopolist. 5. Monopoly outcome versus competition outcome Consider the daily market for hot dogs in a small city. Imagine that this market is in long-run competitive equilibrium with many hot dog stands in the city, each one selling the same kind of hot dogs. Therefore, each vendor is a price taker and possesses no market power Monopaly Outcome The following...
 5. Monopoly outcome versus competition outcome Consider the daily market for hot dogs in a small city. Suppose that this market is in long-run competitive equilibrium with many hot dog stands in the city, each one selling the same kind of hot dogs. Therefore, each vendor is a price taker and possesses no market power. The following graph shows the demand (D) and supply (S = MC) curves in the market for hot dogs. Place the black point (plus symbol) on the graph...
 Competitive market or monopoly for both drop down
menus.
5. Monopoly outcome versus competition outcome Consider the daily market for hot dogs in a small city. Suppose that this market is in long-run competitive equilibrium with many hot dog stands in the city, each one selling the same kind of hot dogs. Therefore, each vendor is a price taker and possesses no market power. The following graph shows the demand (D) and supply (S MC) curves in the market for...
Competitive market or monopoly for both drop down
menus.
5. Monopoly outcome versus competition outcome Consider the daily market for hot dogs in a small city. Suppose that this market is in long-run competitive equilibrium with many hot dog stands in the city, each one selling the same kind of hot dogs. Therefore, each vendor is a price taker and possesses no market power. The following graph shows the demand (D) and supply (S MC) curves in the market for...
 We were unable to transcribe this imageNow, assume that one of the hot dog stands successfully lobbies the city council to obtain the exclusive right to sell hot dogs within the city limits. This firm buys up all the rest of the hot dog stands in the city and operates as a monopoly. Assume that this change doesn't affect demand and that the new monopoly's marginal cost curve corresponds exactly to the supply curve on the previous graph. Under this...
 5. Monopoly outcome versus competition outcome sider the daily market for hot dogs in a small city. Suppose that this market is in long-run competitive equilibrium, with many hot dog stands in he city, each one selling the same kind of hot dogs. Therefore, each vendor is a price taker and possesses no market power. The following graph shows the demand (D) and supply curves (S MC) in the market for hot dogs Place the black point (plus symbol) on...
 CENGAGE | MINDTAP Aplia Homework: Monopoly 5. Monopoly outcome versus competition outcome Consider the daily market for hot dogs in a small city. Suppose that this market is in long-run competitive equilibrium, with many hot dog stands in the city, each one selling the same kind of hot dogs. Therefore, each vendor is a price taker and possesses no market power. The following graph shows the demand (D) and supply curves (S - MC) in the market for hot dogs....
Most questions answered within 3 hours.
-
Write a program to solve the Josephus problem, with the following
modification:
Sample Input:
./a.out n...
asked 26 minutes ago -
At the start of a CD it is spinning at a rate of 525 rpm
(revolutions...
asked 1 hour ago -
4. Without doing any calculations, predict whether the observed
∆T would increase, decrease or remain the...
asked 2 hours ago -
Based on the range, which of the following sets of scores has
the greatest variability? 3,...
asked 3 hours ago -
Ripples in a pond travel at a velocity of 3 m/s with one peak
passing a...
asked 3 hours ago -
A man stands on the roof of a building of height 13.0 mm and
throws a...
asked 3 hours ago -
The extent to which assets are financed by borrowed funds and
other liabilities is indicated by:...
asked 4 hours ago -
Explain in detail
Germany is the fifth largest economy
explain what goods and services Germany specializes...
asked 4 hours ago -
The density of platinum is 21.45 g/mL. If a cube of platinum
with a mass of...
asked 4 hours ago -
Accounts Receivable
Sales
A/R Posting
Extended Sales Invoice
Packing Slip
Compare invoice to packing slip 2...
asked 4 hours ago -
Michaella, age 23, is a full-time law student and is claimed by
her parents as a...
asked 4 hours ago -
Why are polymers not typically casted into products?
asked 5 hours ago