Mark Gershon, owner of a musical instrument distributorship, thinks that demand for guitars may be related...
Mark Gershon, owner of a musical instrument distributorship, thinks that demand for guitars may be related to the number of television appearances by the popular group Maroon 5 during the previous month. Gershon has collected the data shown in the following table:
|
Maroon 5 TV Appearances |
33 |
33 |
66 |
66 |
88 |
55 |
|
Demand for Guitars |
22 |
66 |
66 |
66 |
99 |
77 |
This exercise contains only parts b, c, and d.
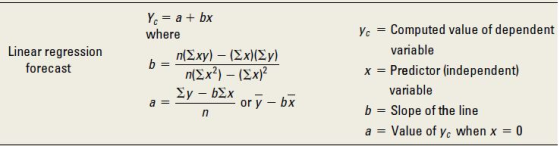
b) Using the least-squares regression method, the equation for forecasting is (round your responses to four decimal places):
Y =__+___x
C) What is your estimate for guitar sales if Maroon 5 performed on TV nine times last month?
D) What are the correlation coefficient (r) and the coefficient of determination (r^2) for this model, and what do they mean?
Homework Answers
| TV Appearance (x) | Demand (y) | x*y | x*x | y*y |
| 33 | 22 | 726 | 1,089 | 484 |
| 33 | 66 | 2,178 | 1,089 | 4,356 |
| 66 | 66 | 4,356 | 4,356 | 4,356 |
| 66 | 66 | 4,356 | 4,356 | 4,356 |
| 88 | 99 | 8,712 | 7,744 | 9,801 |
| 55 | 77 | 4,235 | 3,025 | 5,929 |
| 341 | 396 | 24,563 | 21,659 | 29,282 |
| n | 6 | |||
| n*Sum(xy) | 147,378 | |||
| Sumx*Sumy | 135,036 | |||
| n*sumx2 | 129,954 | |||
| (Sumx)2 | 116,281 |
b = (147378-135036)/(129954-116281) = 0.90
a = (396-341*0.90)/6 = 14.70
B) y = 14.70 + 0.90*x
C) For x = 9, y = 14.70 + 0.9*9 = 22.82
D)

| n*sum(xy) | 147378 | |
| Sumx*Sumy | 135036 | |
| Root(nSumx2-(sumx)2)*Root(n*Sumy2)-(Sumy)2 16065.23 | ||
r = (147378-135036)/16065.23 = 0.77
r^2 = (0.77)^2 = 0.59
The r^2 value is less than 0.8, so it means that TV appearance is the moderate predictor for demand
Add Answer to:
Mark Gershon, owner of a musical instrument distributorship,
thinks that demand for guitars may be related...
Mark Gershon, owner of a musical instrument distributorship, thinks that demand for guitars may be related...
Mark Gershon, owner of a musical instrument distributorship, thinks that demand for guitars may be related to the number of television appearances by the popular group Maroon 5 during the previous month. Gershon has collected the data shown in the following table: Maroon 5 TV Appearances 3 5 7 6 7 6 Demand for Guitars 3 6 7 6 9 6 b) using the least squares regression method, the equation for forecasting is y=_____+___x c) The estimate for guotar...
Mark Gershon, owner of a musical instrument distributorship, thinks that demand for guitars may be related...
Mark Gershon, owner of a musical instrument distributorship, thinks that demand for guitars may be related to the number of television appearances by the popular group Maroon 5 during the previous month. Gershon has collected the data shown in the following table: Maroon 5 TV Appearances 33 55 77 55 77 55 Demand for Guitars 44 66 88 66 1111 66 This exercise contains only parts b, c, and d. b) Using the least-squares regression method, the equation for...
Mark Gershon, owner of a musical instrument distributorship, thinks that demand for guitars may be related...
Mark Gershon, owner of a musical instrument distributorship, thinks that demand for guitars may be related to the number of television appearances by the popular group Maroon 5 during the previous month. Gershon has collected the data shown in the following table: Maroon 5 TV Appearances 33 55 66 77 77 66 Demand for Guitars 33 55 88 44 1010 77 This exercise contains only parts b, c, and d. b) Using the least-squares regression method, the equation for...
Mark Gershon, owner of a musical instrument distributorship, thinks that demand for guitars may be related...
 Mark Gershon, owner of a musical instrument distributorship, thinks that demand for guitars may be related to the number of television appearances by the popular group Maroon 5 during the previous month. Gershon has collected the data shown in the following table: Maroon 5 TV Appearances Demand for Guitars 4 4 6 5 8 5 4 5 8 6 98 This exercise contains only parts b, c, and d. b) Using the least-squares regression method, the equation for forecasting is...
..4.43 Mark Gershon, owner of a musical instrument dis- tributorship, thinks that demand for guitars may...
 ..4.43 Mark Gershon, owner of a musical instrument dis- tributorship, thinks that demand for guitars may be related to the umber of television appearances by the popular group Maroon 5 during the previous month. Mark has collected the data shown in the following table: DEMAND FOR GUITARS 3 6 7 5 10 7 MAROON 5 TV APPEARANCES 4 6 a) Graph these data to see whether a linear equation might describe the relationship between the group's television shows b) Use...
1)The operations manager of a musical instrument distributor feels that demand for a particular type of...
 1)The operations manager of a musical instrument distributor feels that demand for a particular type of guitar may be related to the number of YouTube views for a music video by the popular rock group Marble Pumpkins during the preceding month. The manager has collected the data shown in the following table: YouTube Views Guitar (1,000s) 30 40 70 60 80 50 Sales 12 15 a) Graph these data to see whether a linear equation might describe the b) Using...
 Mark Gershon, owner of a musical instrument distributorship, thinks that demand for guitars may be related to the number of television appearances by the popular group Maroon 5 during the previous month. Gershon has collected the data shown in the following table: Maroon 5 TV Appearances Demand for Guitars 4 4 6 5 8 5 4 5 8 6 98 This exercise contains only parts b, c, and d. b) Using the least-squares regression method, the equation for forecasting is...
 ..4.43 Mark Gershon, owner of a musical instrument dis- tributorship, thinks that demand for guitars may be related to the umber of television appearances by the popular group Maroon 5 during the previous month. Mark has collected the data shown in the following table: DEMAND FOR GUITARS 3 6 7 5 10 7 MAROON 5 TV APPEARANCES 4 6 a) Graph these data to see whether a linear equation might describe the relationship between the group's television shows b) Use...
 1)The operations manager of a musical instrument distributor feels that demand for a particular type of guitar may be related to the number of YouTube views for a music video by the popular rock group Marble Pumpkins during the preceding month. The manager has collected the data shown in the following table: YouTube Views Guitar (1,000s) 30 40 70 60 80 50 Sales 12 15 a) Graph these data to see whether a linear equation might describe the b) Using...
Most questions answered within 3 hours.
-
Please explain steps:
An 80 kg swimmer steps off a platform 10 m above the water...
asked 25 minutes ago -
A lottery exists where balls numbered 1 to 17 are placed in an
urn. To win,...
asked 28 minutes ago -
26) Briefly describe, using words or simple diagrams, the
chemiosmotic theory for coupling oxidation to phosphorylation...
asked 2 hours ago -
Suppose that XX is a random variable with mean 16 and standard
deviation 5 . Also...
asked 3 hours ago -
Calculate the number density of argon gas at a temperature of
24C and a pressure of...
asked 6 hours ago -
Alternative
Classification
How to Estimate
Probabilities from Data? ( For continuous Attributes)
And How to generate...
asked 6 hours ago -
An explosion breaks a 20.0-kg object into three parts. The
object is initially moving at a...
asked 7 hours ago -
Calculate the approximate number of residues of Rubisco, which
is involved in carbon fixation in plants,...
asked 8 hours ago -
Other decisions about scientific claims can have a much broader
impact.ENERGYarrow-10x10.png, environment, health, security - all...
asked 9 hours ago -
I need to write a research paper and work cited about this
topic: The United States...
asked 9 hours ago -
Hello! I was wondering if I could have some help?
If the vapor pressure of carvone...
asked 9 hours ago -
An economist wants to estimate the mean per capita income (in
thousands of dollars) for a...
asked 10 hours ago