How much should a healthy Shetland pony weigh? Let x be the age of the pony...
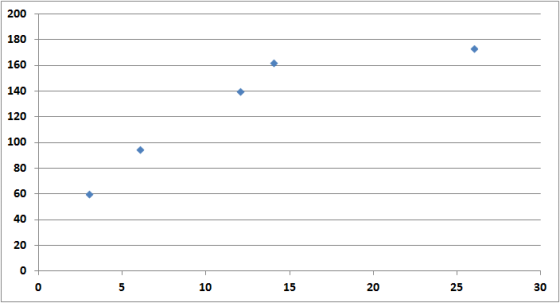
How much should a healthy Shetland pony weigh? Let x be the age of the pony (in months), and let y be the average weight of the pony (in kilograms).
| x | 3 | 6 | 12 | 14 | 26 |
| y | 60 | 95 | 140 | 162 | 173 |
(a) Make a scatter diagram of the data.
Then visualize the line you think best fits the data.
(b) Use a calculator to verify that Σx = 61,
Σx2 = 1061, Σy = 630,
Σy2 = 88,398, and Σxy = 9,196.
Compute r. (Round to 3 decimal places.)
As x increases, does the value of r imply that
y should tend to increase or decrease? Explain your
answer.
A)Given our value of r, y should tend to remain constant as x increases
B)Given our value of r, we can not draw any conclusions for the behavior of y as x increases.
C) Given our value of r, y should tend to decrease as x increases.
D)Given our value of r, y should tend to increase as x increases.
Homework Answers
a )
b)
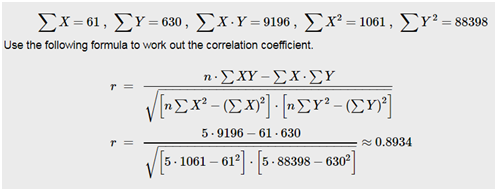
r = 0.893
* D) Given our value of r, y should tend to increase as x increases
Add Answer to:
How much should a healthy Shetland pony weigh? Let x be
the age of the pony...
How much should a healthy Shetland pony weigh? Let x be the age of the pony...
How much should a healthy Shetland pony weigh? Let x be the age of the pony (in months), and let y be the average weight of the pony (in kilograms). X: 3, 6, 12, 18, 22 Y: 60, 95,140, 170, 183 (b) Use a calculator to verify that Σx = 61, Σx2 = 997, Σy = 648, Σy2 = 94,614, and Σxy = 9,516. compute R (round to 3 decimal places)
How much should a healthy Shetland pony weigh? Let x be the age of the pony...
How much should a healthy Shetland pony weigh? Let x be the age of the pony (in months), and let y be the average weight of the pony (in kilograms). x 3 6 12 20 26 y 60 95 140 154 183 (a) Make a scatter diagram of the data and visualize the line you think best fits the data. (b) Would you say the correlation is low, moderate, or strong? low moderate strong Would you say the correlation is...
How much should a healthy Shetland pony weigh? Let x be the age of the pony...
 How much should a healthy Shetland pony weigh? Let x be the age of the pony (in months), and let y be the average weight of the pony (in kilograms). 3 6 12 18 22 60 95 140 152 185 (a) Make a scatter diagram of the data and visualize the line you think best fits the data. Vi Sauton Object ● Point 1122 285 1.1 1A5 Help WebA sign graphing tool (b) Would you say the correlation is low,...
Ignore the Adobe Flash Player Part How much should a healthy Shetland pony weigh? Let x...
 Ignore the Adobe Flash Player Part
How much should a healthy Shetland pony weigh? Let x be the age of the pony (in months), and let y be the average weight of the pony (in kilograms) 3 60 95 6 14 140 170 187 12 26 (a) Make a scatter diagram of the data and visualize the line you think best fits the data Get ADOBE FLASH PLAYER Flash Player version 10 or higher is required for this question You...
Ignore the Adobe Flash Player Part
How much should a healthy Shetland pony weigh? Let x be the age of the pony (in months), and let y be the average weight of the pony (in kilograms) 3 60 95 6 14 140 170 187 12 26 (a) Make a scatter diagram of the data and visualize the line you think best fits the data Get ADOBE FLASH PLAYER Flash Player version 10 or higher is required for this question You...
How much should a healthy Shetland pony weigh? Let x be the age of the pony...
How much should a healthy Shetland pony weigh? Let x be the age of the pony (in months), and let y be the average weight of the pony (in kilograms). x 3 6 12 20 26 y 60 95 140 170 177 (a) Make a scatter diagram of the data. Then visualize the line you think best fits the data. (b) Use a calculator to verify that ?x = 67, ?x2 = 1265, ?y = 642, ?y2 = 92,454, and...
How much should a healthy Shetland pony weigh? Let x be the age of the pony...
 How much should a healthy Shetland pony weigh? Let x be
the age of the pony (in months), and let y be the average
weight of the pony (in kilograms).
x
3
6
12
20
21
y
60
95
140
156
181
(a) Make a scatter diagram of the data.
Flash Player version 10 or higher is required for this
question.
You can get Flash Player free from Adobe's website.
Then visualize the line you think best fits the data....
How much should a healthy Shetland pony weigh? Let x be
the age of the pony (in months), and let y be the average
weight of the pony (in kilograms).
x
3
6
12
20
21
y
60
95
140
156
181
(a) Make a scatter diagram of the data.
Flash Player version 10 or higher is required for this
question.
You can get Flash Player free from Adobe's website.
Then visualize the line you think best fits the data....
Let x be the average number of employees in a group health insurance plan, and let...
Let x be the average number of employees in a group health insurance plan, and let y be the average administrative cost as a percentage of claims. x 3 7 15 38 73 y 40 35 30 28 20 (a) Make a scatter diagram of the data and visualize the line you think best fits the data. (b) Would you say the correlation is low, moderate, or strong? positive or negative? strong and positivestrong and negative low and negativemoderate and negativelow...
Let x be the average number of employees in a group health insurance plan, and let...
Let x be the average number of employees in a group health insurance plan, and let y be the average administrative cost as a percentage of claims. x 3 7 15 36 73 y 40 35 30 28 20 (a) Make a scatter diagram of the data and visualize the line you think best fits the data. Submission Data (b) Would you say the correlation is low, moderate, or strong? positive or negative? strong and positive low and negative low...
Let x be the average number of employees in a group health insurance plan, and let...
Let x be the average number of employees in a group health insurance plan, and let y be the average administrative cost as a percentage of claims. x 3 7 15 38 70 y 40 35 30 26 17 (a) Make a scatter diagram of the data and visualize the line you think best fits the data. (b) Would you say the correlation is low, moderate, or strong? positive or negative? strong and positive low and negative strong and negative...
Let x be the average number of employees in a group health insurance plan, and let...
Let x be the average number of employees in a group health insurance plan, and let y be the average administrative cost as a percentage of claims. x 3 7 15 36 72 y 40 35 30 26 21 (a) Make a scatter diagram of the data and visualize the line you think best fits the data. You can get Flash Player free from Adobe's website. (b) Would you say the correlation is low, moderate, or strong? positive or negative?...
 How much should a healthy Shetland pony weigh? Let x be the age of the pony (in months), and let y be the average weight of the pony (in kilograms). 3 6 12 18 22 60 95 140 152 185 (a) Make a scatter diagram of the data and visualize the line you think best fits the data. Vi Sauton Object ● Point 1122 285 1.1 1A5 Help WebA sign graphing tool (b) Would you say the correlation is low,...
 Ignore the Adobe Flash Player Part
How much should a healthy Shetland pony weigh? Let x be the age of the pony (in months), and let y be the average weight of the pony (in kilograms) 3 60 95 6 14 140 170 187 12 26 (a) Make a scatter diagram of the data and visualize the line you think best fits the data Get ADOBE FLASH PLAYER Flash Player version 10 or higher is required for this question You...
Ignore the Adobe Flash Player Part
How much should a healthy Shetland pony weigh? Let x be the age of the pony (in months), and let y be the average weight of the pony (in kilograms) 3 60 95 6 14 140 170 187 12 26 (a) Make a scatter diagram of the data and visualize the line you think best fits the data Get ADOBE FLASH PLAYER Flash Player version 10 or higher is required for this question You...
 How much should a healthy Shetland pony weigh? Let x be
the age of the pony (in months), and let y be the average
weight of the pony (in kilograms).
x
3
6
12
20
21
y
60
95
140
156
181
(a) Make a scatter diagram of the data.
Flash Player version 10 or higher is required for this
question.
You can get Flash Player free from Adobe's website.
Then visualize the line you think best fits the data....
How much should a healthy Shetland pony weigh? Let x be
the age of the pony (in months), and let y be the average
weight of the pony (in kilograms).
x
3
6
12
20
21
y
60
95
140
156
181
(a) Make a scatter diagram of the data.
Flash Player version 10 or higher is required for this
question.
You can get Flash Player free from Adobe's website.
Then visualize the line you think best fits the data....
Most questions answered within 3 hours.
-
The average length of time between arrivals at a turnpike
toll-booth is 26 seconds. What is...
asked 5 minutes ago -
(a) A piston at 6.1 atm contains a gas that occupies a volume of
3.5 L....
asked 1 hour ago -
Please answer true or false. Words
cannot be changed or added in to make it true...
asked 1 hour ago -
An empty test tube weighs 15.923 grams. Then,
MgCl2•6H2O is added into the test tube. After...
asked 1 hour ago -
Assume memory access is 10 units of time and disk access is
10000 units of time....
asked 1 hour ago -
1. Are all good samples random?
2. Magazines often report surveys giving statistics such as “63%...
asked 1 hour ago -
Under all the various types of market structures, firms
must eventually earn some economic profits for...
asked 1 hour ago -
Consider the following fitness regime for a single locus trait
with two co-dominant alleles: w11 =...
asked 1 hour ago -
A large cable company reports the following.
80% of its customers subscribe to its cable TV...
asked 2 hours ago -
Please answer the question in brief.
Discuss the role of ERP in organizations. Are ERP tools...
asked 1 hour ago -
Discuss the pros and cons of collaborative software such
as SameTime. Does it increase productivity? What...
asked 2 hours ago -
Buying your in-laws a gift because it’s expected is
due to the ____________ motive of gift-giving....
asked 2 hours ago