a. What is the Sample Regression Equation? b. Which of the independent variables are significant? Why?...
a. What is the Sample Regression Equation? b. Which of the independent variables are significant? Why? Use α = 0.10 in ALL questions. Use only the p-value to explain your answers (No need to go to tables). c. Test the overall significance of the model by relying on F Statistic. d. What is the value of adjusted r-square? e. Comment on the Normality assumption for the residuals for this model. In other word, has the normality assumption been satisfied? Explain your answer (Hint: you need to run Excel’s Histogram feature for Column of the Residuals). f. Do you see any Indication of Autocorrelation? Using Excel Formula commands, calculate the value of the Durbin-Watson test statistics in Excel g. Do you see any evidence of Multicollinearity?
y x1 x2 x3
x4 x5
109000 0.19 133
7300 60.9631036 0.006859
155000 0.41 13
18700 96.72900289 0.068921
86060 0.11 20 15000
86.66025617 0.001331
120000 0.68 31
14000 83.75858165 0.314432
153000 0.4 33 23300
108.0115735 0.064
170000 1.21 23
14600 85.50730963 1.771561
90000 0.83 36 22200
105.4419271 0.571787
122900 1.94 4 21200
102.9660138 7.301384
325000 2.29 123
12600 79.75901203 12.008989
120000 0.92 1 22300
105.595928 0.778688
85860 8.97 13 4800
49.05609035 721.734273
97000 0.11 153 3100
40.32988966 0.001331
127000 0.14 9 300
12.42980289 0.002744
89900 2 88 2500
35.9722115 8
155000 0.13 9 300
12.42980289 0.002197
253750 2 7 49800
157.8084282 8
60000 0.21 82 8500
65.50572494 0.009261
87500 0.88 17 19400
98.53172078 0.681472
112000 1 12 8600
65.62011887 1
104900 0.43 21 5600
53.01414905 0.079507
148635 0.32 1 6200
55.68213358 0.032768
150000 0.03 24 5100
50.61620294 0.000027
90400 0.36 16 5200
51.06858134 0.046656
248800 4 28 5500
52.57375771 64
135000 1.83 126
6000 55.34437641 6.128487
145000 3 26 4500
47.57099957 27
457000 0.43 53 2700
37.10121292 0.079507
140000 0.44 56
19400 98.63062405 0.085184
130000 1.24 51
24800 111.4697268 1.906624
187000 0.46 3 15200
87.18658154 0.097336
229000 0.87 9 41100
143.3684066 0.658503
227000 1.8 201
25500 113.3600459 5.832
179900 0.46 1 15200
87.18084652 0.097336
169900 0.91 19
20200 100.5460094 0.753571
209900 0.46 1 15200
87.18084652 0.097336
169900 0.59 10
17300 93.03225247 0.205379
293000 7.24 43
36600 135.3569355 379.503424
24590 0.19 2 20700
101.7398644 0.006859
157000 0.46 45
20200 100.6106356 0.097336
195000 0.41 32
27100 116.4731729 0.068921
150000 0.78 54
24500 110.8016245 0.474552
234900 0.89 9 41600
144.2376511 0.704969
279550 1.34 60
44400 149.0972837 2.406104
246500 1 70 17100
92.65527508 1
124000 1 98 15500
88.3119471 1
138000 0.27 54 8900
66.91038783 0.019683
290000 0.71 73
61000 174.7469599 0.357911
108000 0.9 48 19000
97.59098319 0.729
134900 0.24 10 8000
63.28506933 0.013824
64500 0.06 16 1600
28.42534081 0.000216
142000 0.55 20
13800 83.12640976 0.166375
125000 0.34 32
11100 74.60562981 0.039304
88000 0.19 15 3400
41.32190702 0.006859
135000 0.23 135
8100 64.16774891 0.012167
90000 0.07 14 1800
30.11644069 0.000343
90100 0.09 15 2400
34.74910071 0.000729
126900 0.25 10 8400
64.84597135 0.015625
175000 0.47 15
27200 116.6511894 0.103823
158000 0.36 10
12100 77.81388051 0.046656
92000 0.07 14 1800
30.11644069 0.000343
82800 0.11 225 3900
45.41475531 0.001331
140000 0.23 25 8300
64.5174395 0.012167
171000 3.16 15
24100 109.8066483 31.554496
200640 0.08 4 32000
126.4990119 0.000512
139000 0.57 30 7500
61.35959583 0.185193
225000 0.5 12 15300
87.49857142 0.125
182000 1 16 26600
115.3603051 1
208767 0.5 8 32000
126.5069168 0.125
186000 0.55 17 4400
46.99468055 0.166375
93000 0.1 14 2600
36.15245497 0.001
257386 0.5 90 32000
126.6688596 0.125
161000 0.31 10
10400 72.14568594 0.029791
92000 0.28 18 6300
56.20498199 0.021952
211002 0.06 12
32000 126.5148213 0.000216
115000 0.06 14 1600
28.40774542 0.000216
Homework Answers
(i)
Y = 140338.804455852 + 25546.2055908319 X1 + 82.8778443929468 x2 + 5.27897193819309 x3 -1072.29306616854 X4-326.167534236161 x5
(ii) If p value < 0.10 then the variable is significant. Thus x1,x3 and x5 are significant.

(iii) F statistic is 6.54 and p value is 0. Thus the model is significant.
(iv)
| Adjusted R Square | 0.272520892 |
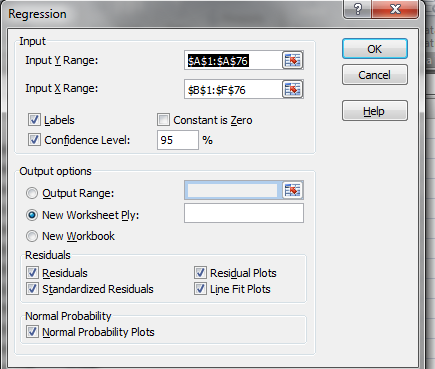
Data ->Data Analysis->Regression--> Input:
The output is:
 Please
let me know in comments in case anything is unclear. Will reply
ASAP. Do upvote if satisfied!
Please
let me know in comments in case anything is unclear. Will reply
ASAP. Do upvote if satisfied!
Add Answer to:
a. What is the Sample Regression Equation? b. Which of the
independent variables are significant? Why?...
Demonstrate regression diagnostics, variables selection and validation.
A hospital administration wished to study the relation between patient satisfaction (Y) and patient’s age (X1), severity of illness (X2) and anxiety level. The administration randomly selected 15 patients and the results of the study are shown below. The regression equation isy = 184 - 0.976 x1 - 1.14 x2 - 12.3 x3 Predictor Coef SE Coef T Constant 184.02 31.70 5.81 x1 -0.9763 0.4500 -2.17 x2 -1.1361 0.9786 -1.16 x3 -12.34 14.30 -0.86 S = 11.0529 R-Sq = 70.2% ...
Questions 1. Given the H NMR spectrum and molec- ular formula for each of the following compounds, deduce the...
 Questions 1. Given the H NMR spectrum and molec- ular formula for each of the following compounds, deduce the structure of the compound, estimate the chemical shifts of all its protons using the parameters in Tables 22.3–22.5, and assign the NMR sig- nals to their respective protons. (a) C.H,,Cl; 1H NMR (CDC12): 8 3.33 (2H, s); 1.10 (9H, s) (b) C-H,,0,; 1H NMR (CDC12): 8 3.88 (1H, s); 2.25 (3H, s); 1.40 (6H, s) (C) CH,,0,; 1H NMR (CDC1,): 8...
Use Table 8.1, a computer, or a calculator to answer the following. Suppose a candidate for...
 Use Table 8.1, a computer, or a calculator to answer the following. Suppose a candidate for public office is favored by only 47% of the voters. If a sample survey randomly selects 2,500 voters, the percentage in the sample who favor the candidate can be thought of as a measurement from a normal curve with a mean of 47% and a standard deviation of 1%. Based on this information, how often (as a %) would such a survey show that...
 Questions 1. Given the H NMR spectrum and molec- ular formula for each of the following compounds, deduce the structure of the compound, estimate the chemical shifts of all its protons using the parameters in Tables 22.3–22.5, and assign the NMR sig- nals to their respective protons. (a) C.H,,Cl; 1H NMR (CDC12): 8 3.33 (2H, s); 1.10 (9H, s) (b) C-H,,0,; 1H NMR (CDC12): 8 3.88 (1H, s); 2.25 (3H, s); 1.40 (6H, s) (C) CH,,0,; 1H NMR (CDC1,): 8...
 Use Table 8.1, a computer, or a calculator to answer the following. Suppose a candidate for public office is favored by only 47% of the voters. If a sample survey randomly selects 2,500 voters, the percentage in the sample who favor the candidate can be thought of as a measurement from a normal curve with a mean of 47% and a standard deviation of 1%. Based on this information, how often (as a %) would such a survey show that...
Most questions answered within 3 hours.
-
Exercise 1. Two players, 1 and 2, take turns choosing numbers; 1
goes first. On his...
asked 17 minutes ago -
Are the following two functions overloaded?
int xyz(int x, int y = 100000);
int xyz(int x,...
asked 25 minutes ago -
An interest rate swap has three years of remaining life.
Payments are exchanged annually. Interest at...
asked 32 minutes ago -
Ensign Johnson is domiciled in Georgia. His wife is domiciled in
New York and moved to...
asked 29 minutes ago -
there are many issues that can be addressed when performing a
RCA. Assuming that there is...
asked 30 minutes ago -
ata pertaining to the postretirement health care benefit plan of
Danielson Delivery Service include the following...
asked 32 minutes ago -
Getting along with the members of your team requires good ____
skills.
a.
authoritative
b.
problem...
asked 40 minutes ago -
During June, Propene Company produced 20,000 chainsaw blades.
The standard quantity of material allowed per unit...
asked 46 minutes ago -
Draw the molecular orbital energy level diagrams and write the
electron configurations of (a) Be2, (b)...
asked 46 minutes ago -
We put a mixture of helium, oxygen and nitrogen gases in a
closed container at 25...
asked 56 minutes ago -
You measure 22 dogs' weights, and find they have a mean weight
of 64 ounces. Assume...
asked 1 hour ago -
Complete and balance the following methesis reaction in aqueous
solution.
Instructions
• Use proper element capitalization....
asked 1 hour ago