The table shows Max’s, Igor’s, and Liza’s demand schedules for potatoes. Assume that Max, Igor, and...
- The table shows Max’s, Igor’s, and Liza’s demand schedules for potatoes. Assume that Max, Igor, and Liza comprise the entire market and complete the table by calculating the market demand schedule.
|
Price (EUR per kilogram) |
Quantity demanded (kilograms per week) |
|||
|
Max |
Igor |
Liza |
Market |
|
|
€0.50 |
10 |
4 |
10 |
|
|
0.75 |
9 |
2 |
7 |
|
|
1.00 |
8 |
0 |
4 |
|
|
1.25 |
7 |
0 |
1 |
|
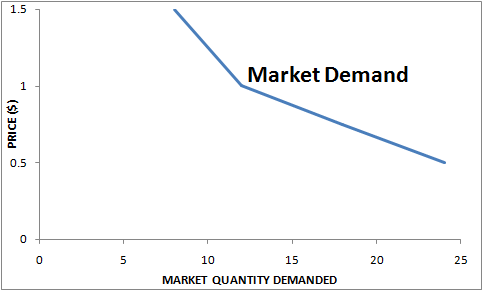
Label the x-axis and y-axis. On the diagram below, draw the market demand curve.
Homework Answers
Market demand = Quantity demanded by Max + Quantity demanded by Igor + Quantity demanded by Liza
Data table:
| Price | QD (Max) | QD (Igor) | QD (Liza) | Market Demand |
| 0.5 | 10 | 4 | 10 | 24 |
| 0.75 | 9 | 2 | 7 | 18 |
| 1 | 8 | 0 | 4 | 12 |
| 1.5 | 7 | 0 | 1 | 8 |
Graph:
Add Answer to:
The table shows Max’s, Igor’s, and Liza’s demand schedules for
potatoes. Assume that Max, Igor, and...
This table shows the US domestic demand and supply schedules for oranges. Suppose the world price...
This table shows the US domestic demand and supply schedules for oranges. Suppose the world price of oranges is $0.30 per orange. Quantities are in thousands. Price Quantity of oranges Demanded Quantity of oranges Supplied $1.00 2 11 0.90 4 10 0.80 6 9 0.70 8 8 0.60 10 7 0.50 12 6 0.40 14 5 0.30 16 4 0.20 18 3 Draw the US domestic supply and demand schedules With free trade, how will the US import or export? How many?...
2. Money supply, money demand, and adjustment to monetary equilibrium The following table shows a money...
 2. Money supply, money demand, and adjustment to monetary equilibrium The following table shows a money demand schedule, which is the quantity of money demanded at various price levels (P). Fill in the value of Money column in the following table. Price Level (P) Value of Money (1/P) Quantity of Money Demanded (Billions of dollars) 1.5 0.80 0.40 1.00 1.00 2.0 1.33 1.33 3.5 2.00 0.50 7.0 Now consider the relationship between the price level and the quantity of money...
The table shows the demand and supply schedules for Quantity demanded Quantity supplied apples Price Suppose...
 The table shows the demand and supply schedules for Quantity demanded Quantity supplied apples Price Suppose that the government introduces a production quota (pounds per week) 5,625 5,000 4,375 3,750 3,125 2,500 for apples and sets it at 3,750 pounds per week. 1.25 2.50 3.75 5.00 6.25 7.50 1,250 2,500 3,750 5,000 6,250 What are the market price of apples, the producer surplus and the deadweight loss created? The market price of apples is $a pound. The producer surplus is...
1. The following table shows the supply and demand schedules in a market. Quantity Demanded 800...
 1. The following table shows the supply and demand schedules in a market. Quantity Demanded 800 Quantity Supplied 0 100 Price $2 $10 $12 $14 $16 500 400 300 200 100 0 300 400 500 600 800 (1 point) Graph the demand and supply curves. (0.5 points) What is the equilibrium price in this market? (0.5 points) What is the equilibrium quantity in this market?
QUESTION 41 (Table: The Market for Soda) Look at the table The Market for Soda. If...
 QUESTION 41 (Table: The Market for Soda) Look at the table The Market for Soda. If the government imposes a price ceiling of S1 per can of soda, the quantity of soda supplied will be: 10 cans. 9 cans Table: The Market for Soda Market for a Can of Soda Price Quantity Demanded Quantity Supplied (S/unit) (cans) (cans) 0.50 0.75 1.00 10 1.25 1.50
The table shows the demand and supply schedules for hot chocolate If the price is $1.40...
 The table shows the demand and supply schedules for hot chocolate If the price is $1.40 a cup, the quantity supplied the quantity demanded and of hot chocolate exists Price (dollars per cup) 1.40 1.75 Quantity Quantity demanded supplied (cups per day] 400 340 360 2 10 360 320 380 245 400 O A. is less than a surplus OB. equals, neither a shortage nor a surplus OC. is greater than a shortage OD. is greater than a surplus O...
2. Consumer surplus for an individual and a market The following graph shows Jacques's weekly demand...
 2. Consumer surplus for an individual and a market The following graph shows Jacques's weekly demand for cheesecake, represented by the blue line. Point A represents a point along his weekly demand curve. The market price of cheesecake is $1.25 per slice, as shown by the horizontal black line. Jacques's Weekly Demand 2.50 Demand 2.25 2.00 1 75 1.50 Price 1 25 1,00 0.75 0.50 0 25 0 2468 101214 16 18 20 QUANTITY (Slices of cheesecake) for his 8th...
2. Money supply, money demand, and adjustment to monetary equilibrium The following table shows a money...
 2. Money supply, money demand, and adjustment to monetary equilibrium The following table shows a money demand schedule, which is the quantity of money demanded at various price levels (P). Fill in the value of Money column in the following table. Quantity of Money Demanded (Billions of dollars) Price Level (P) 1.00 1.5 Value of Money (1/P) 1.00 0.75 0.50 2.0 1.33 2.00 4.00 3.5 7.0 0.25 money Now consider the relationship between the price level and the quantity of...
Q3 The demand schedule for gym subscriptions is in the table. Price (euros per gym subscription...
 Q3 The demand schedule for gym subscriptions is in the table. Price (euros per gym subscription Quantity demanded (hundreds of gym subscriptions per year) a) What happens to total revenue if the price rises from (i) €230 to €280 per gym subscription and from (ii) €280 to €330 per gym subscription? b) At what price is total revenue at a maximum? c) At €230, is the demand for gym subscriptions elastic, inelastic, or unit elastic? Use the total revenue test...
The table shows the demand and supply schedules for pretzels A fall in income decreases the...
 The table shows the demand and supply schedules for pretzels A fall in income decreases the quantity demanded by 500 bags a day at each price At the initial equilibrium price, there is a of pretzels. The price of a bag as the market moves to its new equilibrium Price (dollars per bag) 2.50 2.75 3.00 325 3.50 Quantity Quantity demanded supplied (bags of pretzels per day) 2,500 1,500 2.000 2,000 1,500 2,500 1,000 3,000 3,500 500 O A. shortage,...
 2. Money supply, money demand, and adjustment to monetary equilibrium The following table shows a money demand schedule, which is the quantity of money demanded at various price levels (P). Fill in the value of Money column in the following table. Price Level (P) Value of Money (1/P) Quantity of Money Demanded (Billions of dollars) 1.5 0.80 0.40 1.00 1.00 2.0 1.33 1.33 3.5 2.00 0.50 7.0 Now consider the relationship between the price level and the quantity of money...
 The table shows the demand and supply schedules for Quantity demanded Quantity supplied apples Price Suppose that the government introduces a production quota (pounds per week) 5,625 5,000 4,375 3,750 3,125 2,500 for apples and sets it at 3,750 pounds per week. 1.25 2.50 3.75 5.00 6.25 7.50 1,250 2,500 3,750 5,000 6,250 What are the market price of apples, the producer surplus and the deadweight loss created? The market price of apples is $a pound. The producer surplus is...
 1. The following table shows the supply and demand schedules in a market. Quantity Demanded 800 Quantity Supplied 0 100 Price $2 $10 $12 $14 $16 500 400 300 200 100 0 300 400 500 600 800 (1 point) Graph the demand and supply curves. (0.5 points) What is the equilibrium price in this market? (0.5 points) What is the equilibrium quantity in this market?
 QUESTION 41 (Table: The Market for Soda) Look at the table The Market for Soda. If the government imposes a price ceiling of S1 per can of soda, the quantity of soda supplied will be: 10 cans. 9 cans Table: The Market for Soda Market for a Can of Soda Price Quantity Demanded Quantity Supplied (S/unit) (cans) (cans) 0.50 0.75 1.00 10 1.25 1.50
 The table shows the demand and supply schedules for hot chocolate If the price is $1.40 a cup, the quantity supplied the quantity demanded and of hot chocolate exists Price (dollars per cup) 1.40 1.75 Quantity Quantity demanded supplied (cups per day] 400 340 360 2 10 360 320 380 245 400 O A. is less than a surplus OB. equals, neither a shortage nor a surplus OC. is greater than a shortage OD. is greater than a surplus O...
 2. Consumer surplus for an individual and a market The following graph shows Jacques's weekly demand for cheesecake, represented by the blue line. Point A represents a point along his weekly demand curve. The market price of cheesecake is $1.25 per slice, as shown by the horizontal black line. Jacques's Weekly Demand 2.50 Demand 2.25 2.00 1 75 1.50 Price 1 25 1,00 0.75 0.50 0 25 0 2468 101214 16 18 20 QUANTITY (Slices of cheesecake) for his 8th...
 2. Money supply, money demand, and adjustment to monetary equilibrium The following table shows a money demand schedule, which is the quantity of money demanded at various price levels (P). Fill in the value of Money column in the following table. Quantity of Money Demanded (Billions of dollars) Price Level (P) 1.00 1.5 Value of Money (1/P) 1.00 0.75 0.50 2.0 1.33 2.00 4.00 3.5 7.0 0.25 money Now consider the relationship between the price level and the quantity of...
 Q3 The demand schedule for gym subscriptions is in the table. Price (euros per gym subscription Quantity demanded (hundreds of gym subscriptions per year) a) What happens to total revenue if the price rises from (i) €230 to €280 per gym subscription and from (ii) €280 to €330 per gym subscription? b) At what price is total revenue at a maximum? c) At €230, is the demand for gym subscriptions elastic, inelastic, or unit elastic? Use the total revenue test...
 The table shows the demand and supply schedules for pretzels A fall in income decreases the quantity demanded by 500 bags a day at each price At the initial equilibrium price, there is a of pretzels. The price of a bag as the market moves to its new equilibrium Price (dollars per bag) 2.50 2.75 3.00 325 3.50 Quantity Quantity demanded supplied (bags of pretzels per day) 2,500 1,500 2.000 2,000 1,500 2,500 1,000 3,000 3,500 500 O A. shortage,...
Most questions answered within 3 hours.
-
Problem 2: The Problem of Social Cost. A Rancher and Farmer live
side-by-side to each other....
asked 8 minutes ago -
Define Diet counceling? What are the
responsibilities of a counselor?
asked 1 hour ago -
Hey im just confused about how to put the ' A angle n' and ' S...
asked 1 hour ago -
A short essay about the WSJ article on Oreo versus Hydrox.
asked 1 hour ago -
##8. A program contains the following function definition:
##def cube(num):
##return num * num * num...
asked 1 hour ago -
find the value z of a standard Normal variable that satisfies
each of the given conditions....
asked 2 hours ago -
"banana".find('z')
Out[22]: -1
why is this -1
python 3.7
asked 1 hour ago -
Ilegal Consideration Marna Balin was involved in two automobile
accidents in which she suffered severe injures.She...
asked 2 hours ago -
Walk through the operation of QuickSort when n = 7 and the input
array is A...
asked 1 hour ago -
Answer with True or False. Argue the answers
7) The circulation of field B on any...
asked 2 hours ago -
Chase Co. uses the perpetual inventory method. The inventory
records for Chase reflected the following
Jan...
asked 2 hours ago -
what are is the correct compression for these two ipv6 ips.. i
keep getting them wrong...
asked 2 hours ago