

Note: Round each of the discounted values of the of dividends to the nearest tenth decimal place before plotting it on the graph. You can mouse over the points in the graph to see their coordinates. DIVIDENDS Is 5.00 Discounted Dividends 4.00 FV of Dividends 3.00 2.00 10, 1.3 1.00 PV of Dividends 0.00 0 10 20 30 40 50 60 YEARS
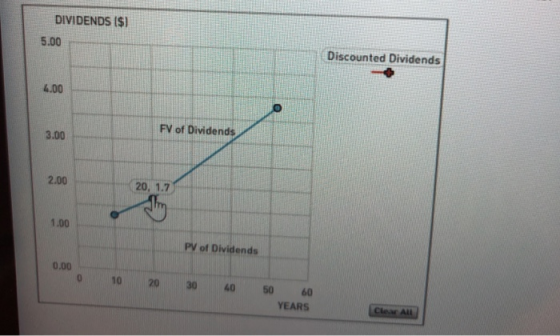
DIVIDENDS Is) 5.00 Discounted Dividends 4.00 FV of Dividends 3.00 2.00 20, 1.7 1.00 PV of Dividends 0.00 0 10 20 30 40 50 60 YEARS
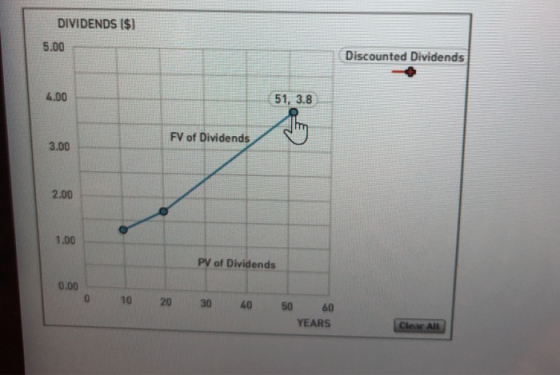
DIVIDENDS I$) 5.00 Discounted Dividends 4.00 51, 3.8 FV of Dividends 3.00 2.00 1.00 PV of Dividends 0.00 0 10 20 30 40 50 60 YEARS
Homework Answers
Here ,
Dividend of current year (D0) = $1.00
Dividend Growth rate (g) = 2.70%
Dividend of nth year (Dn) = D0 ( 1+g) n
Discount rate (r) = 8.40%
Present value of dividend = 
| Time Period | Dividend Expected Future Value | Expected Dividend's Present value | ||
| Now | $1.00 | |||
| End of Year 10 | 1*(1.027^10)= | $1.3053 | 1.3053/(1.084^10)= | $0.5827 |
| End of Year 20 | 1*(1.027^20)= | $1.7038 | 1.7038/(1.084^20)= | $0.3395 |
| End of Year 50 | 1*(1.027^50)= | $3.7890 | 3.7890/(1.084^50)= | $0.0672 |
Add Answer to:
3. Expected dividends as a basis for stock values The following graph shows the value of a stock'...
2. Expected dividends as a basis for stock values The following graph shows the value of...
 2. Expected dividends as a basis for stock values The following graph shows the value of a stock's dividends over time. The stock's current dividend is $1.00 per share, and dividends are expected to grow at a constant rate of 3.50% per year. The intrinsic value of a stock should equal the sum of the present value (PV) of all of the dividends that a stock is supposed to pay in the future, but many people find it difficult to...
4. Expected dividends as a basis for stock values The following graph shows the value of a stock's dividends over time....
 4. Expected dividends as a basis for stock values The following graph shows the value of a stock's dividends over time. The stock's current dividend is $1.00 per share, and dividends are expected to grow at a constant rate of 4.50% per year. The intrinsic value of a stock should equal the sum of the present value (PV) of all of the dividendss that a stock is supposed to pay in the future, but many people find it difficult to...
4. Expected dividends as a basis for stock values Аа А The following graph shows the...
 4. Expected dividends as a basis for stock values Аа А The following graph shows the value of a stock's dividends over time. The stock's current dividend is $1.00 per share, and dividends are expected to grow at a constant rate of 4.50% per year. The intrinsic value of a stock should equal the sum of the present value (PV) of all of the dividends that a stock is supposed to pay in the future, but many people find it...
8. Expected dividends as a basis for stock values The following graph shows the value of...
 8. Expected dividends as a basis for stock values The following graph shows the value of a stock's dividends over time. The stock's current dividend is $1.00, and dividends are expected to grow at a constant rate of 3.50% per year. The intrinsic value of a stock should equal the sum of the present value (PV) of all of the dividends that a stock is supposed to pay in the future, but many people find it difficult to imagine adding...
The following graph shows the value of a stock's dividends over time. The stock's current dividend...
 The following graph shows the value of a stock's dividends over time. The stock's current dividend is $1.00 per share, and dividends are expected to grow at a constant rate of 2.70% per year. The intrinsic value of a stock should equal the sum of the present value (PV) of all of the dividends that a stock is supposed to pay in the future, but many people find it difficult to imagine adding up an infinite number of dividends. Calculate...
4. The following graph shows the value of a stock's dividends over time. The stock's current...
 4.
The following graph shows the value of a stock's dividends over time. The stock's current dividend is $1.00 per share, and dividends are expected to grow at a constant rate of 3.50% per year. The intrinsic value of a stock should equal the sum of the present value (PV) of all of the dividends that a stock is supposed to pay in the future, but many people find it difficult to imagine adding up an infinite number of dividends....
4.
The following graph shows the value of a stock's dividends over time. The stock's current dividend is $1.00 per share, and dividends are expected to grow at a constant rate of 3.50% per year. The intrinsic value of a stock should equal the sum of the present value (PV) of all of the dividends that a stock is supposed to pay in the future, but many people find it difficult to imagine adding up an infinite number of dividends....
4. Expected dividends as a basis for stock values The following graph shows the value of...
 4. Expected dividends as a basis for stock values The following graph shows the value of a stock's dividends over time. The stock's current dividend is $1.00 per share, and dividends are expected to grow at a constant rate of 4.50% per year. The intrinsic value of a stock should equal the sum of the present value (PV) of all of the dividends that a stock is supposed to pay in the future, but many people find it difficult to...
 2. Expected dividends as a basis for stock values The following graph shows the value of a stock's dividends over time. The stock's current dividend is $1.00 per share, and dividends are expected to grow at a constant rate of 3.50% per year. The intrinsic value of a stock should equal the sum of the present value (PV) of all of the dividends that a stock is supposed to pay in the future, but many people find it difficult to...
 2. Expected dividends as a basis for stock values The following graph shows the value of a stock's dividends over time. The stock's current dividend is $1.00 per share, and dividends are expected to grow at a constant rate of 3.50% per year. The intrinsic value of a stock should equal the sum of the present value (PV) of all of the dividends that a stock is supposed to pay in the future, but many people find it difficult to...
 4. Expected dividends as a basis for stock values The following graph shows the value of a stock's dividends over time. The stock's current dividend is $1.00 per share, and dividends are expected to grow at a constant rate of 4.50% per year. The intrinsic value of a stock should equal the sum of the present value (PV) of all of the dividendss that a stock is supposed to pay in the future, but many people find it difficult to...
 4. Expected dividends as a basis for stock values Аа А The following graph shows the value of a stock's dividends over time. The stock's current dividend is $1.00 per share, and dividends are expected to grow at a constant rate of 4.50% per year. The intrinsic value of a stock should equal the sum of the present value (PV) of all of the dividends that a stock is supposed to pay in the future, but many people find it...
 8. Expected dividends as a basis for stock values The following graph shows the value of a stock's dividends over time. The stock's current dividend is $1.00, and dividends are expected to grow at a constant rate of 3.50% per year. The intrinsic value of a stock should equal the sum of the present value (PV) of all of the dividends that a stock is supposed to pay in the future, but many people find it difficult to imagine adding...
 8. Expected dividends as a basis for stock values The following graph shows the value of a stock's dividends over time. The stock's current dividend is $1.00, and dividends are expected to grow at a constant rate of 3.50% per year. The intrinsic value of a stock should equal the sum of the present value (PV) of all of the dividends that a stock is supposed to pay in the future, but many people find it difficult to imagine adding...
 The following graph shows the value of a stock's dividends over time. The stock's current dividend is $1.00 per share, and dividends are expected to grow at a constant rate of 2.70% per year. The intrinsic value of a stock should equal the sum of the present value (PV) of all of the dividends that a stock is supposed to pay in the future, but many people find it difficult to imagine adding up an infinite number of dividends. Calculate...
 4.
The following graph shows the value of a stock's dividends over time. The stock's current dividend is $1.00 per share, and dividends are expected to grow at a constant rate of 3.50% per year. The intrinsic value of a stock should equal the sum of the present value (PV) of all of the dividends that a stock is supposed to pay in the future, but many people find it difficult to imagine adding up an infinite number of dividends....
4.
The following graph shows the value of a stock's dividends over time. The stock's current dividend is $1.00 per share, and dividends are expected to grow at a constant rate of 3.50% per year. The intrinsic value of a stock should equal the sum of the present value (PV) of all of the dividends that a stock is supposed to pay in the future, but many people find it difficult to imagine adding up an infinite number of dividends....
 4. Expected dividends as a basis for stock values The following graph shows the value of a stock's dividends over time. The stock's current dividend is $1.00 per share, and dividends are expected to grow at a constant rate of 4.50% per year. The intrinsic value of a stock should equal the sum of the present value (PV) of all of the dividends that a stock is supposed to pay in the future, but many people find it difficult to...
 4. Expected dividends as a basis for stock values The following graph shows the value of a stock's dividends over time. The stock's current dividend is $1.00 per share, and dividends are expected to grow at a constant rate of 4.50% per year. The intrinsic value of a stock should equal the sum of the present value (PV) of all of the dividends that a stock is supposed to pay in the future, but many people find it difficult to...
Most questions answered within 3 hours.
-
. A permanent magnet is dropped south-end-down through a horizontal
circular coil with a radius of...
asked 22 seconds from now -
Bernie's Beverages purchased some fixed assets classified as
5-year property for MACRS. The assets cost $28,000....
asked 13 minutes ago -
How many ATPs are produced from the catabolism of a 10-C
molecule of fatty acid under...
asked 17 minutes ago -
Before practicing a routine on the rings, a 64.8 kg gymnast
hangs motionless, with one hand...
asked 19 minutes ago -
If the K b of a weak base is 6.3 × 10 − 6 , what...
asked 26 minutes ago -
Which of the following is the minimum amount of moles of NaOH
that must be added...
asked 29 minutes ago -
Stories about organizational ________ provide important clues
about cultural values and norms.
a. myths
b. heroes...
asked 31 minutes ago -
Explain the criteria used in selecting a target market
BUS220 Retail Management, thank you!
asked 33 minutes ago -
Convert/Calculate the following:
Determine the identity of an elemental gas if 4.55 L weighing
35.4g, under...
asked 36 minutes ago -
Consider the equilibrium C(s)+ CO2(g) ⇌2 CO(g)
A 2.0 L flask contains a mixture of 0.10...
asked 35 minutes ago -
MATLAB
Part 1 – randFloatValue.m This function accepts two numbers,
lower and upper, and returns a...
asked 41 minutes ago -
You have been asked to hide prizes around your house for your
3-year old nephew. His...
asked 42 minutes ago