
Homework Answers
we are supposed to answer 1 question at a time. This is for 6
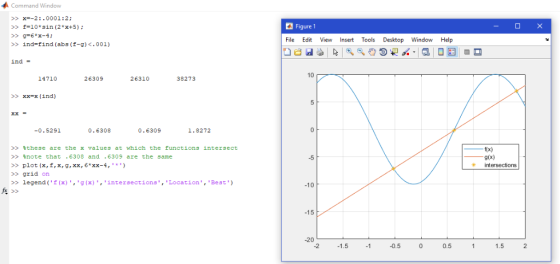
x=-2:.0001:2;
f=10*sin(2*x+5);
g=6*x-4;
ind=find(abs(f-g)<.001)
xx=x(ind)
%these are the x values at which the functions intersect
%note that .6308 and .6309 are the same
plot(x,f,x,g,xx,6*xx-4,'*')
grid on
legend('f(x)','g(x)','intersections','Location','Best')
Add Answer to:
6. Use Matlab to find the point(s) of intersection (if any) between the functions f()10sin(2 5) a...
PLEASE USE MATLAB COMMANDS THANK YOU Use Matlab to graph the functions f(x) = 3xsin(3x) and...
 PLEASE USE MATLAB COMMANDS THANK YOU
Use Matlab to graph the functions f(x) = 3xsin(3x) and g(x)= 12 - 2x² so that you can read off the point(s) of intersection (if any), accurate up to two decimal places. 1) Write down the Matlab command(s) you used to create the x-vector. 2) Write down the Matlab command(s) you used to produce the vectors containing the f- and g-function values. 3) Write down the Matlab command(s) you used to plot the graphs....
PLEASE USE MATLAB COMMANDS THANK YOU
Use Matlab to graph the functions f(x) = 3xsin(3x) and g(x)= 12 - 2x² so that you can read off the point(s) of intersection (if any), accurate up to two decimal places. 1) Write down the Matlab command(s) you used to create the x-vector. 2) Write down the Matlab command(s) you used to produce the vectors containing the f- and g-function values. 3) Write down the Matlab command(s) you used to plot the graphs....
Comprehension Check 1. Write commands to solve the equation e <x+2 by graphing functions and determining...
 Comprehension Check 1. Write commands to solve the equation e <x+2 by graphing functions and determining points of intersection. Putting it All Together Create a new section in your Live Script for this portion. Include all commands, output and graphs you use. Add explanations as needed. Consider the function below (after giving it your name and filling in the month and day of the month of your birth). -YOUR-NAME-(x) 《cos (.5#x)-exp《co s (x-Day)))/sqrt(Month-x^2) - Use Matlab to do each of...
USE MATLAB TO ANSWER PLEASE Let u = | 2 | and v = . Use the MATLAB functions normo, cross(), and dot() , to complete th...
 USE MATLAB TO ANSWER PLEASE
Let u = | 2 | and v = . Use the MATLAB functions normo, cross(), and dot() , to complete the -6 following tasks: (a) Determine the length of u and v. Write down the answer produced by MATLAB, accurate to 4 decimal places (b) Compute u x v; call this vector w. (c) Verify that w is orthogonal to both u and v
Let u = | 2 | and v = ....
USE MATLAB TO ANSWER PLEASE
Let u = | 2 | and v = . Use the MATLAB functions normo, cross(), and dot() , to complete the -6 following tasks: (a) Determine the length of u and v. Write down the answer produced by MATLAB, accurate to 4 decimal places (b) Compute u x v; call this vector w. (c) Verify that w is orthogonal to both u and v
Let u = | 2 | and v = ....
Use Newton's Method to approximate the x-value of the point of intersection of the two graphs...
 Use Newton's Method to approximate the x-value of the point of intersection of the two graphs of f(x) = 3x + 1 and g(x) = Vx+5 to 5 decimal places. Use your calculator to find the x-value of the intersection to 5 decimal places and calculate your error until your approximation matching the calculator's.
Use Newton's Method to estimate the x-value of the point of intersection of the graphs of...
 Use Newton's Method to estimate the x-value of the point of intersection of the graphs of the functions to three decimal places. Continue the iterations until two successive approximations differ by less than 0.001. See Example 3. F(x) = -x + 4 g(x) - Inex) 2 2 4 5
(a) if f(x) = 5* - 6 and g(x) = 2x-5 graph fand g on the...
 (a) if f(x) = 5* - 6 and g(x) = 2x-5 graph fand g on the same Cartesian plane and plot the point of intersection (b) Find the point of intersection of the graphs off and g by solving f(x) = g(x). (c) Based on the graph, solve f(x)>g(x). (a) Choose the graph below that shows the intersection of f(x) = 5*-8 and g(x)=2x-5. The window display is [-10, 10, 1] by [-1, 14, 1). ОА. B. OC. a Q...
II. Using Newton’s method, write a MATLAB program to find the fixed point of the following...
II. Using Newton’s method, write a MATLAB program to find the fixed point of the following function: ?(?) = √? + ?? accurate to at least 8 decimal places. (HINT: finding the fixed point of f(x) is the same as finding the zero of g(x) = f(x) − x. ) The output of this program should display in a single table (i) the solution for the fixed point, (ii) the initial guess, (iii) the number of iterations it took to...
code in Matlab Problem 1: The MATLAB humps function defines a curve that has 2 maxima (peaks) of unequal height over the interval 0 2, f(x) = r-0.3)2 +0.01 (r-09 +0.04 Use MATLAB to generate a plo...
 code in Matlab
Problem 1: The MATLAB humps function defines a curve that has 2 maxima (peaks) of unequal height over the interval 0 2, f(x) = r-0.3)2 +0.01 (r-09 +0.04 Use MATLAB to generate a plot of Kx) versus x with x [0:1/256:2: Do not use MATLAB's built-in humps function to generate the values of Rx). Also, employ the minimum number of periods to perform the vector operations needed to eneate x) values for the plo
Problem 1: The...
code in Matlab
Problem 1: The MATLAB humps function defines a curve that has 2 maxima (peaks) of unequal height over the interval 0 2, f(x) = r-0.3)2 +0.01 (r-09 +0.04 Use MATLAB to generate a plot of Kx) versus x with x [0:1/256:2: Do not use MATLAB's built-in humps function to generate the values of Rx). Also, employ the minimum number of periods to perform the vector operations needed to eneate x) values for the plo
Problem 1: The...
This is matlab questions,please use Julia and give me Julia commands process to slove the questions....
 This is matlab questions,please use Julia and give me Julia
commands process to slove the questions.
(3) Find an interval [a,b] on which f(x) = x cos(x) and gle) = 7 / 7 satisfies g(x)=f(). Your interval must be in [0,2]. have endpoints accurate to the nearest thousandth, and be as large as possible. Construct a graph showing both fanda on [o, 2] and on which your interval is. visible. (2) Let g(x) = x'+1+56 log 14-3x). The function has...
This is matlab questions,please use Julia and give me Julia
commands process to slove the questions.
(3) Find an interval [a,b] on which f(x) = x cos(x) and gle) = 7 / 7 satisfies g(x)=f(). Your interval must be in [0,2]. have endpoints accurate to the nearest thousandth, and be as large as possible. Construct a graph showing both fanda on [o, 2] and on which your interval is. visible. (2) Let g(x) = x'+1+56 log 14-3x). The function has...
please explain how to do step 5 in matlab commands. med at x=c. 2 The first derivative Ne Scr We investigate the function f(x) 4 12x3+9x2. >> x-linspace (-3,3) >> y-41x.^4-12*x.^3 >...
 please explain how
to do step 5 in matlab commands.
med at x=c. 2 The first derivative Ne Scr We investigate the function f(x) 4 12x3+9x2. >> x-linspace (-3,3) >> y-41x.^4-12*x.^3 >> plot (x,y), grid 9*x."2; + A plot over the interval I-3,3] reveals an apparent "flat section"' with no visible relati extrema. To produce a plot that reveals the true structure of the graph, we replot over the interval [-1,2]: >> x=linspace (-1,2); >> y= 4 * x. ^4-12*x.^3...
please explain how
to do step 5 in matlab commands.
med at x=c. 2 The first derivative Ne Scr We investigate the function f(x) 4 12x3+9x2. >> x-linspace (-3,3) >> y-41x.^4-12*x.^3 >> plot (x,y), grid 9*x."2; + A plot over the interval I-3,3] reveals an apparent "flat section"' with no visible relati extrema. To produce a plot that reveals the true structure of the graph, we replot over the interval [-1,2]: >> x=linspace (-1,2); >> y= 4 * x. ^4-12*x.^3...
 PLEASE USE MATLAB COMMANDS THANK YOU
Use Matlab to graph the functions f(x) = 3xsin(3x) and g(x)= 12 - 2x² so that you can read off the point(s) of intersection (if any), accurate up to two decimal places. 1) Write down the Matlab command(s) you used to create the x-vector. 2) Write down the Matlab command(s) you used to produce the vectors containing the f- and g-function values. 3) Write down the Matlab command(s) you used to plot the graphs....
PLEASE USE MATLAB COMMANDS THANK YOU
Use Matlab to graph the functions f(x) = 3xsin(3x) and g(x)= 12 - 2x² so that you can read off the point(s) of intersection (if any), accurate up to two decimal places. 1) Write down the Matlab command(s) you used to create the x-vector. 2) Write down the Matlab command(s) you used to produce the vectors containing the f- and g-function values. 3) Write down the Matlab command(s) you used to plot the graphs....
 Comprehension Check 1. Write commands to solve the equation e <x+2 by graphing functions and determining points of intersection. Putting it All Together Create a new section in your Live Script for this portion. Include all commands, output and graphs you use. Add explanations as needed. Consider the function below (after giving it your name and filling in the month and day of the month of your birth). -YOUR-NAME-(x) 《cos (.5#x)-exp《co s (x-Day)))/sqrt(Month-x^2) - Use Matlab to do each of...
 USE MATLAB TO ANSWER PLEASE
Let u = | 2 | and v = . Use the MATLAB functions normo, cross(), and dot() , to complete the -6 following tasks: (a) Determine the length of u and v. Write down the answer produced by MATLAB, accurate to 4 decimal places (b) Compute u x v; call this vector w. (c) Verify that w is orthogonal to both u and v
Let u = | 2 | and v = ....
USE MATLAB TO ANSWER PLEASE
Let u = | 2 | and v = . Use the MATLAB functions normo, cross(), and dot() , to complete the -6 following tasks: (a) Determine the length of u and v. Write down the answer produced by MATLAB, accurate to 4 decimal places (b) Compute u x v; call this vector w. (c) Verify that w is orthogonal to both u and v
Let u = | 2 | and v = ....
 Use Newton's Method to approximate the x-value of the point of intersection of the two graphs of f(x) = 3x + 1 and g(x) = Vx+5 to 5 decimal places. Use your calculator to find the x-value of the intersection to 5 decimal places and calculate your error until your approximation matching the calculator's.
 Use Newton's Method to estimate the x-value of the point of intersection of the graphs of the functions to three decimal places. Continue the iterations until two successive approximations differ by less than 0.001. See Example 3. F(x) = -x + 4 g(x) - Inex) 2 2 4 5
 (a) if f(x) = 5* - 6 and g(x) = 2x-5 graph fand g on the same Cartesian plane and plot the point of intersection (b) Find the point of intersection of the graphs off and g by solving f(x) = g(x). (c) Based on the graph, solve f(x)>g(x). (a) Choose the graph below that shows the intersection of f(x) = 5*-8 and g(x)=2x-5. The window display is [-10, 10, 1] by [-1, 14, 1). ОА. B. OC. a Q...
 code in Matlab
Problem 1: The MATLAB humps function defines a curve that has 2 maxima (peaks) of unequal height over the interval 0 2, f(x) = r-0.3)2 +0.01 (r-09 +0.04 Use MATLAB to generate a plot of Kx) versus x with x [0:1/256:2: Do not use MATLAB's built-in humps function to generate the values of Rx). Also, employ the minimum number of periods to perform the vector operations needed to eneate x) values for the plo
Problem 1: The...
code in Matlab
Problem 1: The MATLAB humps function defines a curve that has 2 maxima (peaks) of unequal height over the interval 0 2, f(x) = r-0.3)2 +0.01 (r-09 +0.04 Use MATLAB to generate a plot of Kx) versus x with x [0:1/256:2: Do not use MATLAB's built-in humps function to generate the values of Rx). Also, employ the minimum number of periods to perform the vector operations needed to eneate x) values for the plo
Problem 1: The...
 This is matlab questions,please use Julia and give me Julia
commands process to slove the questions.
(3) Find an interval [a,b] on which f(x) = x cos(x) and gle) = 7 / 7 satisfies g(x)=f(). Your interval must be in [0,2]. have endpoints accurate to the nearest thousandth, and be as large as possible. Construct a graph showing both fanda on [o, 2] and on which your interval is. visible. (2) Let g(x) = x'+1+56 log 14-3x). The function has...
This is matlab questions,please use Julia and give me Julia
commands process to slove the questions.
(3) Find an interval [a,b] on which f(x) = x cos(x) and gle) = 7 / 7 satisfies g(x)=f(). Your interval must be in [0,2]. have endpoints accurate to the nearest thousandth, and be as large as possible. Construct a graph showing both fanda on [o, 2] and on which your interval is. visible. (2) Let g(x) = x'+1+56 log 14-3x). The function has...
 please explain how
to do step 5 in matlab commands.
med at x=c. 2 The first derivative Ne Scr We investigate the function f(x) 4 12x3+9x2. >> x-linspace (-3,3) >> y-41x.^4-12*x.^3 >> plot (x,y), grid 9*x."2; + A plot over the interval I-3,3] reveals an apparent "flat section"' with no visible relati extrema. To produce a plot that reveals the true structure of the graph, we replot over the interval [-1,2]: >> x=linspace (-1,2); >> y= 4 * x. ^4-12*x.^3...
please explain how
to do step 5 in matlab commands.
med at x=c. 2 The first derivative Ne Scr We investigate the function f(x) 4 12x3+9x2. >> x-linspace (-3,3) >> y-41x.^4-12*x.^3 >> plot (x,y), grid 9*x."2; + A plot over the interval I-3,3] reveals an apparent "flat section"' with no visible relati extrema. To produce a plot that reveals the true structure of the graph, we replot over the interval [-1,2]: >> x=linspace (-1,2); >> y= 4 * x. ^4-12*x.^3...
Most questions answered within 3 hours.
-
What advantages are there to using piperidine rather than
hydroxide as a base?
asked 25 seconds ago -
Your friend tells you that there is a vending machine on campus
that dispenses M&M packs...
asked 2 minutes ago -
7. The life of a Freeze Breeze electric fan is normally
distributed with a mean 4...
asked 3 minutes ago -
1. A 751 mL NaCl solution is diluted to a volume of 1.06 L and a...
asked 8 minutes ago -
8
A $20,000 face value STRIPS is currently quoted at 38.642 and
has 8 years to...
asked 8 minutes ago -
The current exchange rate between the Japanese yen and
the US dollar is 120 yen per...
asked 10 minutes ago -
Marla’s Massages and More bought a special massage table two
years ago for $9,300. At the...
asked 17 minutes ago -
Suppose you require a peak output voltage of 15.0 V and have
available an AC source...
asked 18 minutes ago -
We
conduct A study to estimate the mean age of the population of women
at the...
asked 29 minutes ago -
.13 : Assume that we make an enhancement to a computer that
improves some mode of...
asked 31 minutes ago -
4)
Find the tension in an elevator cable if the 1000 kg elevator is
descending with...
asked 37 minutes ago -
A random sample of 51 newborn babies was taken at the Hospital.
The sample mean was...
asked 35 minutes ago