The Money Pit Mortgage Company is interested in monitoring the performance of the mortgage process.
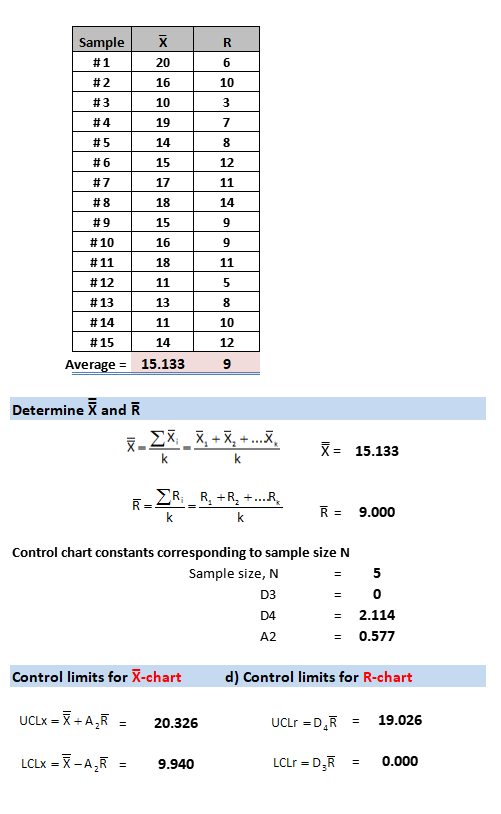
The Money Pit Mortgage Company is interested in monitoring the performance of the mortgage process. Fifteen samples of five completed mortgage transactions each were taken during a period when the process was believed to be in control. The times to complete the transactions were measured. The means and ranges of the mortgage process transaction times, measured in days, are as follows:
| Sample | 1 | 2 | 3 | 4 | 5 | 6 | 7 | 8 | 9 | 10 | 11 | 12 | 13 | 14 | 15 |
|---|---|---|---|---|---|---|---|---|---|---|---|---|---|---|---|
| Mean | 20 | 16 | 10 | 19 | 14 | 15 | 17 | 18 | 15 | 16 | 18 | 11 | 13 | 11 | 14 |
| Range | 6 | 10 | 3 | 7 | 8 | 12 | 11 | 14 | 9 | 9 | 11 | 5 | 8 | 10 | 12 |
Subsequently, samples of size 5 were taken from the process every week for the next 10 weeks. The times were measured and the following results obtained:
| Sample | 16 | 17 | 18 | 19 | 20 | 21 | 22 | 23 | 24 | 25 |
|---|---|---|---|---|---|---|---|---|---|---|
| Mean | 13 | 16 | 11 | 17 | 19 | 20 | 15 | 24 | 22 | 20 |
| Range | 7 | 10 | 5 | 3 | 11 | 14 | 10 | 9 | 7 | 5 |
Click the icon to view the table of factors for calculating three-sigma limits for thex-chart and R-chart.
a. Construct the control charts for the mean and the range, using the original 15 samples
Set up the R-chart by specifying the center line and three-sigma control limits below. (Enter your responses rounded to two decimal places.,)
| R-chart |
|---|
| UCL_(R)=19.026 |
| bar(R)=9 |
| LCL_(R)=0 |
Set up the x-chart by specifying the center line and three-sigma control limits below. (Enter your responses rounded to two decimal places.)

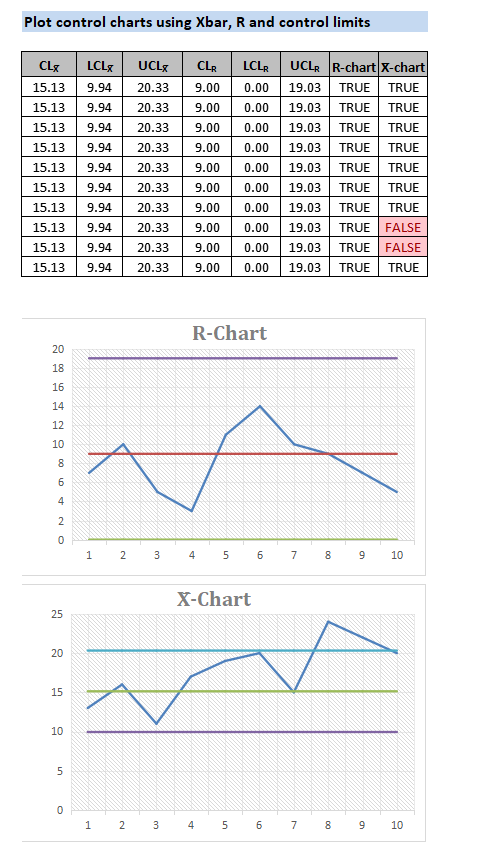
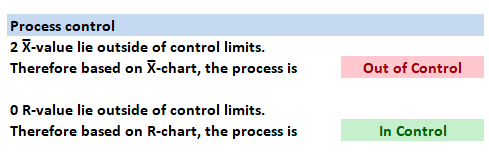
b. On the control charts developed in part (a), plot the values from samples 16 through 25 and comment on whether the process is in control Choose the correct R-chart for the data below

c. In part (b), if you concluded that the process was out of control, would you attribute it to a drift in the mean, or an increase in the variability, or both?
The process variability is _______ statistical control and the process average is _______ statistical control. Therefore, the entire process is _______ control.
Homework Answers
(a) Control limits of Xbar and R-chart
(b)
(c)
We see that R chart is in control, but Xbar chart is out of control. Therefore,
The process variability is __In__ statistical control, and the process average is __Out of__ statistical control. Therefore, the entire process is __Out of__ control.
Add Answer to:
The Money Pit Mortgage Company is interested in monitoring the performance of the mortgage process.
Most questions answered within 3 hours.
-
A 747 has a cruising speed of 235 m/s at a height of 10,700
meters. The...
asked 3 minutes ago -
Part 3: Arrows
Write a python program that prompts the user for a number of
columns,...
asked 10 minutes ago -
Need help answering these questions!!
1. What economic concept do you find most interesting in
Macroeconomics?...
asked 14 minutes ago -
1. Nimbus, Inc. produces and sells brooms. This table shows the
relationship between the number of...
asked 18 minutes ago -
A gas occupies 200. mL in a piston. If the pressure of the
piston were decreased...
asked 34 minutes ago -
A fossil is found to have a 14C level of 71.0% compared to
living organisms. How...
asked 38 minutes ago -
Many communist or socialist countries have a department that
addresses public health as well as the...
asked 40 minutes ago -
the following questions are either true or false answers
1. The Central Limit Theorem allows one...
asked 40 minutes ago -
The patient recovery time from a particular surgical procedure
is normally distributed with a mean of...
asked 46 minutes ago -
Human relations refer to the way a company arranges people,
jobs, and communications so that work...
asked 1 hour ago -
Python Program: Design the logic for and implement a program
that merges the two files into...
asked 1 hour ago -
The specific radiocarbon activity of a sample of wood is 6.25
gms dpm/gm of carbon. The...
asked 1 hour ago