Consider the following data on x and y shown in the table below, x 2 4 7 10 12 15 18 20 21 25 ...
Consider the following data on x and y shown in the table below,
| x | 2 | 4 | 7 | 10 | 12 | 15 | 18 | 20 | 21 | 25 |
| y | 5 | 10 | 12 | 22 | 25 | 27 | 39 | 50 | 47 | 65 |
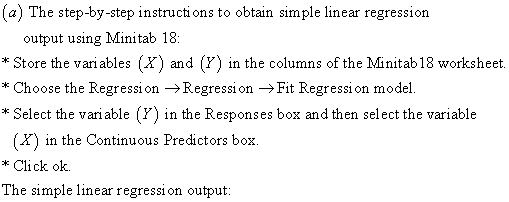
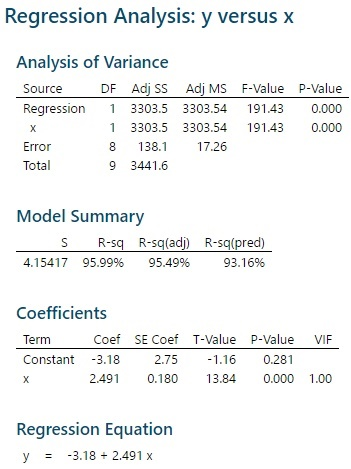
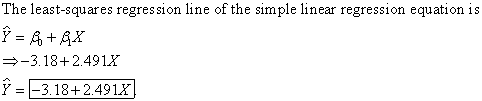
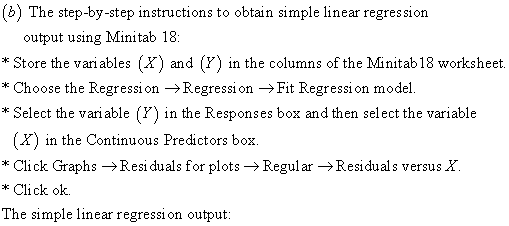
Fit the model E(y)=β0+β1x to the data, and plot the residuals versus x for the model on Minitab. Do you detect any trends? If so, what does the pattern suggest about the model?
Homework Answers
-------------------------------------------------------------------------------------------------------------------------------------------------------

Interpretation:
The plot of the residuals versus the independent variable (X) for the model explains the linear relationship between the variables. There is no existence of non-linear pattern in the plot and there is no evidence of unequal variances in the data. The pattern is linear and it explains 95.99 of the variation in the dependent variable (Y) can be explained by the independent variable (X) of the model. The model is a very good fit for the given data.
Add Answer to:
Consider the following data on x and y shown in the table below, x 2 4 7 10 12 15 18 20 21 25 ...
Essay questions 1. in exercise 6.3 step 5, what can you say about the assumption of constant vari...
 Essay questions
1. in exercise 6.3 step 5, what can you say about the assumption
of constant variance?
2. in exercise 6.3 step 7, what can you say about the assumption
of constant variance?
3. in exercise 6.3 step 8, what can you say about the assumption
of normality
Exercise 6.3 Let us consider the salary (y), the years of experience(K1) and the years of schooling (X2) for 50 employees of the Georgia Pacific Company in Crossett, Arkansas. Our goal...
Essay questions
1. in exercise 6.3 step 5, what can you say about the assumption
of constant variance?
2. in exercise 6.3 step 7, what can you say about the assumption
of constant variance?
3. in exercise 6.3 step 8, what can you say about the assumption
of normality
Exercise 6.3 Let us consider the salary (y), the years of experience(K1) and the years of schooling (X2) for 50 employees of the Georgia Pacific Company in Crossett, Arkansas. Our goal...
H-35 20 8 10 12 5 10 20 10 7 4 15 4 25 8 7...
 H-35 20 8 10 12 5 10 20 10 7 4 15 4 25 8 7 4 582 10 7 697787 676 10 3 12 10 5 3 1 5357 2 FYNNN YYYYYY Y N N N N N N N N N N N c-25 19 22 20 22 31 21 18 24 20 28 23 29ー// 23 22 25 21 22 21 I- BMFFM F F M M M M M F F F F F F M...
Consider the data. xi 2 6 9 13 20 yi 9 18 8 25 21 a....
Consider the data. xi 2 6 9 13 20 yi 9 18 8 25 21 a. What is the value of the standard error of the estimate? (Round your answer to three decimal places.) (b) Test for a significant relationship by using the t test. Use α = 0.05. State the null and alternative hypotheses. H0: β1 = 0 Ha: β1 ≠ 0 H0: β0 ≠ 0 Ha: β0 = 0 H0: β1 ≠ 0 Ha: β1 = 0 H0:...
Consider the following small data set. x-11 y- 22 , x-15 y-16 , x-12 y-27 , x-6 y-26 ,x-5 y- 21 Find the linear correlat...
Consider the following small data set. x-11 y- 22 , x-15 y-16 , x-12 y-27 , x-6 y-26 ,x-5 y- 21 Find the linear correlation coefficient. r=
Game Point_Differential Assists Rebounds Turnovers Personal_Fouls 1 15 15 38 11 9 2 36 20 43 &
 Game
Point_Differential Assists
Rebounds Turnovers Personal_Fouls
1 15 15 38
11 9
2 36 20 43
8 13
3 16 21 29
7 13
4 45 22 46
11 11
5 12 11 40
7 22
6 -10 10 31
13 26
7 11 19 45
11 7
8 12 16 32
16 14
9 3 16 27
18 15
10 19 9 34
17 17
11 40 16 41
9 17
12 44 12 29
9 22
13 16 ...
Game
Point_Differential Assists
Rebounds Turnovers Personal_Fouls
1 15 15 38
11 9
2 36 20 43
8 13
3 16 21 29
7 13
4 45 22 46
11 11
5 12 11 40
7 22
6 -10 10 31
13 26
7 11 19 45
11 7
8 12 16 32
16 14
9 3 16 27
18 15
10 19 9 34
17 17
11 40 16 41
9 17
12 44 12 29
9 22
13 16 ...
Consider the following data for a dependent variable y and two independent variables, 21 and 22....
 Consider the following data for a dependent variable y and two independent variables, 21 and 22. 21 22 30 12 95 47 11 108 25 18 113 51 16 178 40 5 94 52 20 176 74 7 171 36 12 118 59 13 142 77 16 211 Round your all answers to two decimal places. Enter negative values as negative numbers, if necessary. a. Develop an estimated regression equation relating y to @i. + 31 Predict y if *1...
For the two variables of interest: Create a scatter plot with Percent Time Asleep as the...
For the two variables of interest: Create a scatter plot with Percent Time Asleep as the independent variable x and Longevity as the dependent variable y. The plot must include an informative title, along with correct labels for both axes. Include a plot of the least-squares equation (see #5 below). Calculate the correlation coefficient and the coefficient of determination. Identify any data points on the scatter diagram that appear to be influential. Use Cook's Distance > (4⁄√n) as the criterion...
Read in the Kyphosis data file where y is the outcome of interest and x is...
Read in the Kyphosis data file where y is the outcome of interest and x is our lone predictor. (a) Fit a logistic regression model of the form logit [P(Y= 1)] =α+β1x. Test the effect of x. (b) Fit a logistic model of the form logit[P(Y= 1)] =α+β1x+β2x2. Is the squared term significant? (c) Plot̂π(x) as a function of x for both the models in (a) and (b). Compare. This is data x y 12 1 15 1 42 1 52...
A sales manager collected the following data on x = years of experience and y =...
 A sales manager collected the following data on x = years of experience and y = annual sales ($1,000s). The estimated regression equation for these data is y = 82 + 4x. Salesperson Years of Experience Annual Sales ($1,000s) 80 97 102 107 103 101 119 o 128 11 127 10 13 136 (a) Compute the residuals. (a) Compute the residuals. Years of Experience Annual Sales ($1,000s) Residuals 102 107 103 101 119 128 127 136 Construct a residual plot....
Consider the following data for two variables, x and y.
 Consider the following data for two variables, x and y. a. Choose the correct scatter diagram with x and y. The correct scatter diagram is - _______ . Does there appear to be a linear relationship between x and y? Explain. The scatter diagram- Select your answer - some evidence of a possible linear relationship. b. Develop the estimated regression equation relating x and y. Save "predicted" and "residuals" (to 4 decimals). c. Choose the correct scatter diagram or the residuals versus y tor the estimated...
 Essay questions
1. in exercise 6.3 step 5, what can you say about the assumption
of constant variance?
2. in exercise 6.3 step 7, what can you say about the assumption
of constant variance?
3. in exercise 6.3 step 8, what can you say about the assumption
of normality
Exercise 6.3 Let us consider the salary (y), the years of experience(K1) and the years of schooling (X2) for 50 employees of the Georgia Pacific Company in Crossett, Arkansas. Our goal...
Essay questions
1. in exercise 6.3 step 5, what can you say about the assumption
of constant variance?
2. in exercise 6.3 step 7, what can you say about the assumption
of constant variance?
3. in exercise 6.3 step 8, what can you say about the assumption
of normality
Exercise 6.3 Let us consider the salary (y), the years of experience(K1) and the years of schooling (X2) for 50 employees of the Georgia Pacific Company in Crossett, Arkansas. Our goal...
 H-35 20 8 10 12 5 10 20 10 7 4 15 4 25 8 7 4 582 10 7 697787 676 10 3 12 10 5 3 1 5357 2 FYNNN YYYYYY Y N N N N N N N N N N N c-25 19 22 20 22 31 21 18 24 20 28 23 29ー// 23 22 25 21 22 21 I- BMFFM F F M M M M M F F F F F F M...
 Game
Point_Differential Assists
Rebounds Turnovers Personal_Fouls
1 15 15 38
11 9
2 36 20 43
8 13
3 16 21 29
7 13
4 45 22 46
11 11
5 12 11 40
7 22
6 -10 10 31
13 26
7 11 19 45
11 7
8 12 16 32
16 14
9 3 16 27
18 15
10 19 9 34
17 17
11 40 16 41
9 17
12 44 12 29
9 22
13 16 ...
Game
Point_Differential Assists
Rebounds Turnovers Personal_Fouls
1 15 15 38
11 9
2 36 20 43
8 13
3 16 21 29
7 13
4 45 22 46
11 11
5 12 11 40
7 22
6 -10 10 31
13 26
7 11 19 45
11 7
8 12 16 32
16 14
9 3 16 27
18 15
10 19 9 34
17 17
11 40 16 41
9 17
12 44 12 29
9 22
13 16 ...
 Consider the following data for a dependent variable y and two independent variables, 21 and 22. 21 22 30 12 95 47 11 108 25 18 113 51 16 178 40 5 94 52 20 176 74 7 171 36 12 118 59 13 142 77 16 211 Round your all answers to two decimal places. Enter negative values as negative numbers, if necessary. a. Develop an estimated regression equation relating y to @i. + 31 Predict y if *1...
 A sales manager collected the following data on x = years of experience and y = annual sales ($1,000s). The estimated regression equation for these data is y = 82 + 4x. Salesperson Years of Experience Annual Sales ($1,000s) 80 97 102 107 103 101 119 o 128 11 127 10 13 136 (a) Compute the residuals. (a) Compute the residuals. Years of Experience Annual Sales ($1,000s) Residuals 102 107 103 101 119 128 127 136 Construct a residual plot....
Most questions answered within 3 hours.
-
The free energy change for the following reaction at 25 °C, when
[Sn2+] = 1.17 M...
asked 41 minutes ago -
An MNE is this kind of industry when competition in one country
is essentially independent of...
asked 2 hours ago -
. For this set of questions, determine what
proportion of a normal distribution is located betweeneach...
asked 2 hours ago -
A college student is employed as a door-to-door newspaper
salesman. Historical data suggests that the student...
asked 3 hours ago -
MATLAB HW 11 problem using Switch Case and Input commands
Write a script file that calculates...
asked 3 hours ago -
Considering gravitational time dilation, calculate the time that
passes in Earth’s surface while 1 hour passes...
asked 4 hours ago -
Minitab Problem: Take the Lake Hume June rainfall data and find
use the processes outlined in...
asked 5 hours ago -
X Company is trying to decide whether to continue using old
equipment to make Product A...
asked 5 hours ago -
IN PYTHON ONLY !! Program 2: Re-work
program #5 (WeeklyHours) from the previous assignment such that...
asked 5 hours ago -
The average length of time between arrivals at a turnpike
toll-booth is 26 seconds. What is...
asked 7 hours ago -
(a) A piston at 6.1 atm contains a gas that occupies a volume of
3.5 L....
asked 8 hours ago -
Please answer true or false. Words
cannot be changed or added in to make it true...
asked 8 hours ago